Key Takeaways
- ▲ Injective is showing early channel behavior after a 32.75% 30-day recovery, but confirmation still depends on a clean move above the $4.20-$4.35 resistance band.
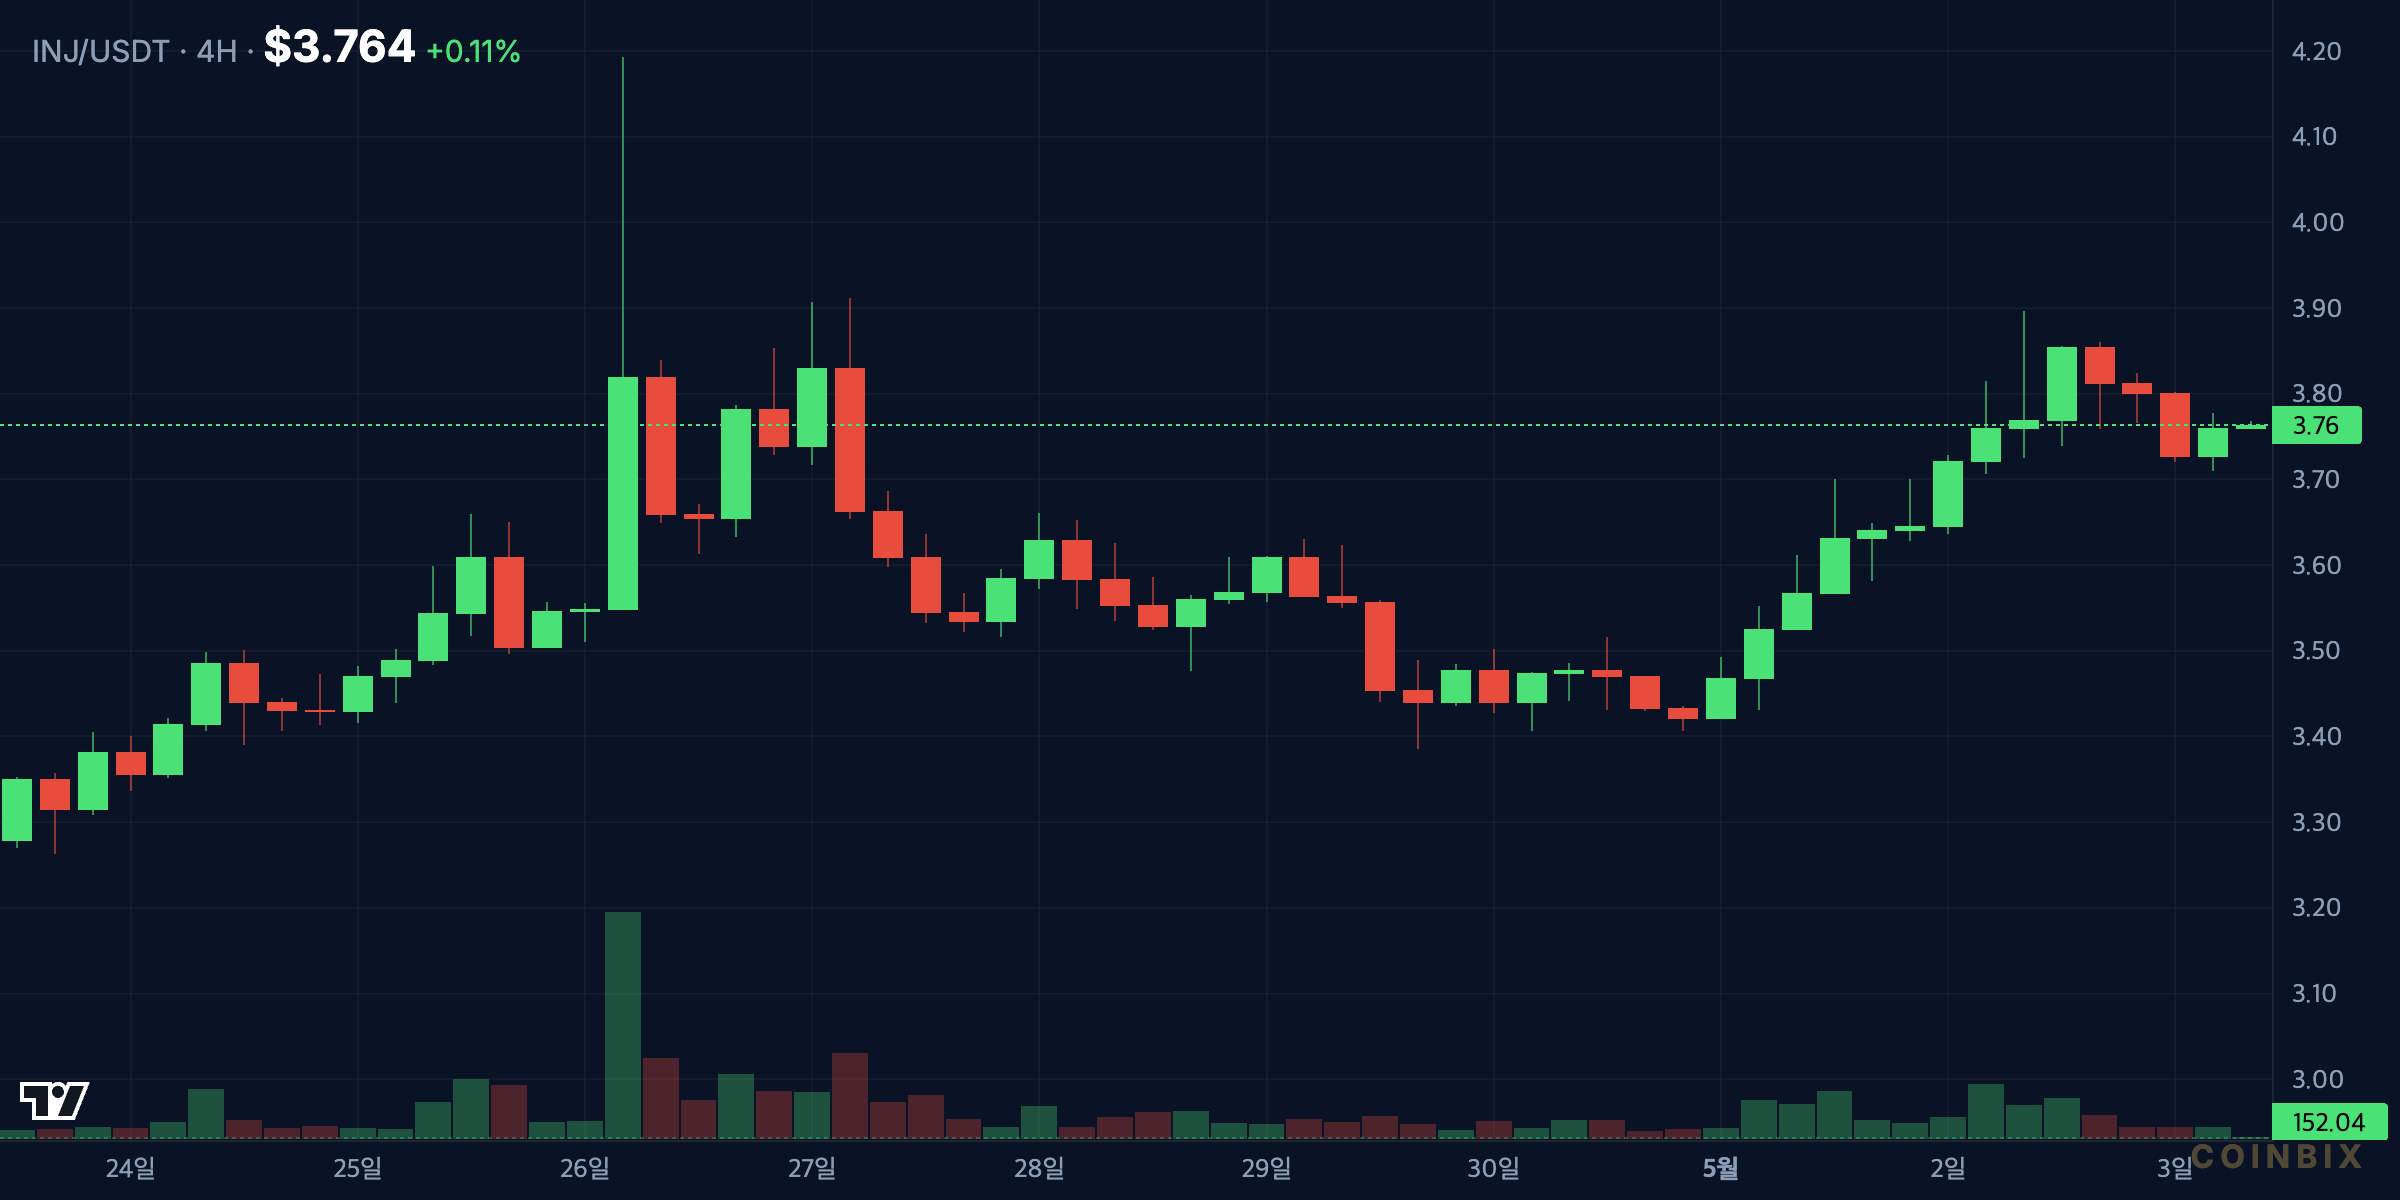
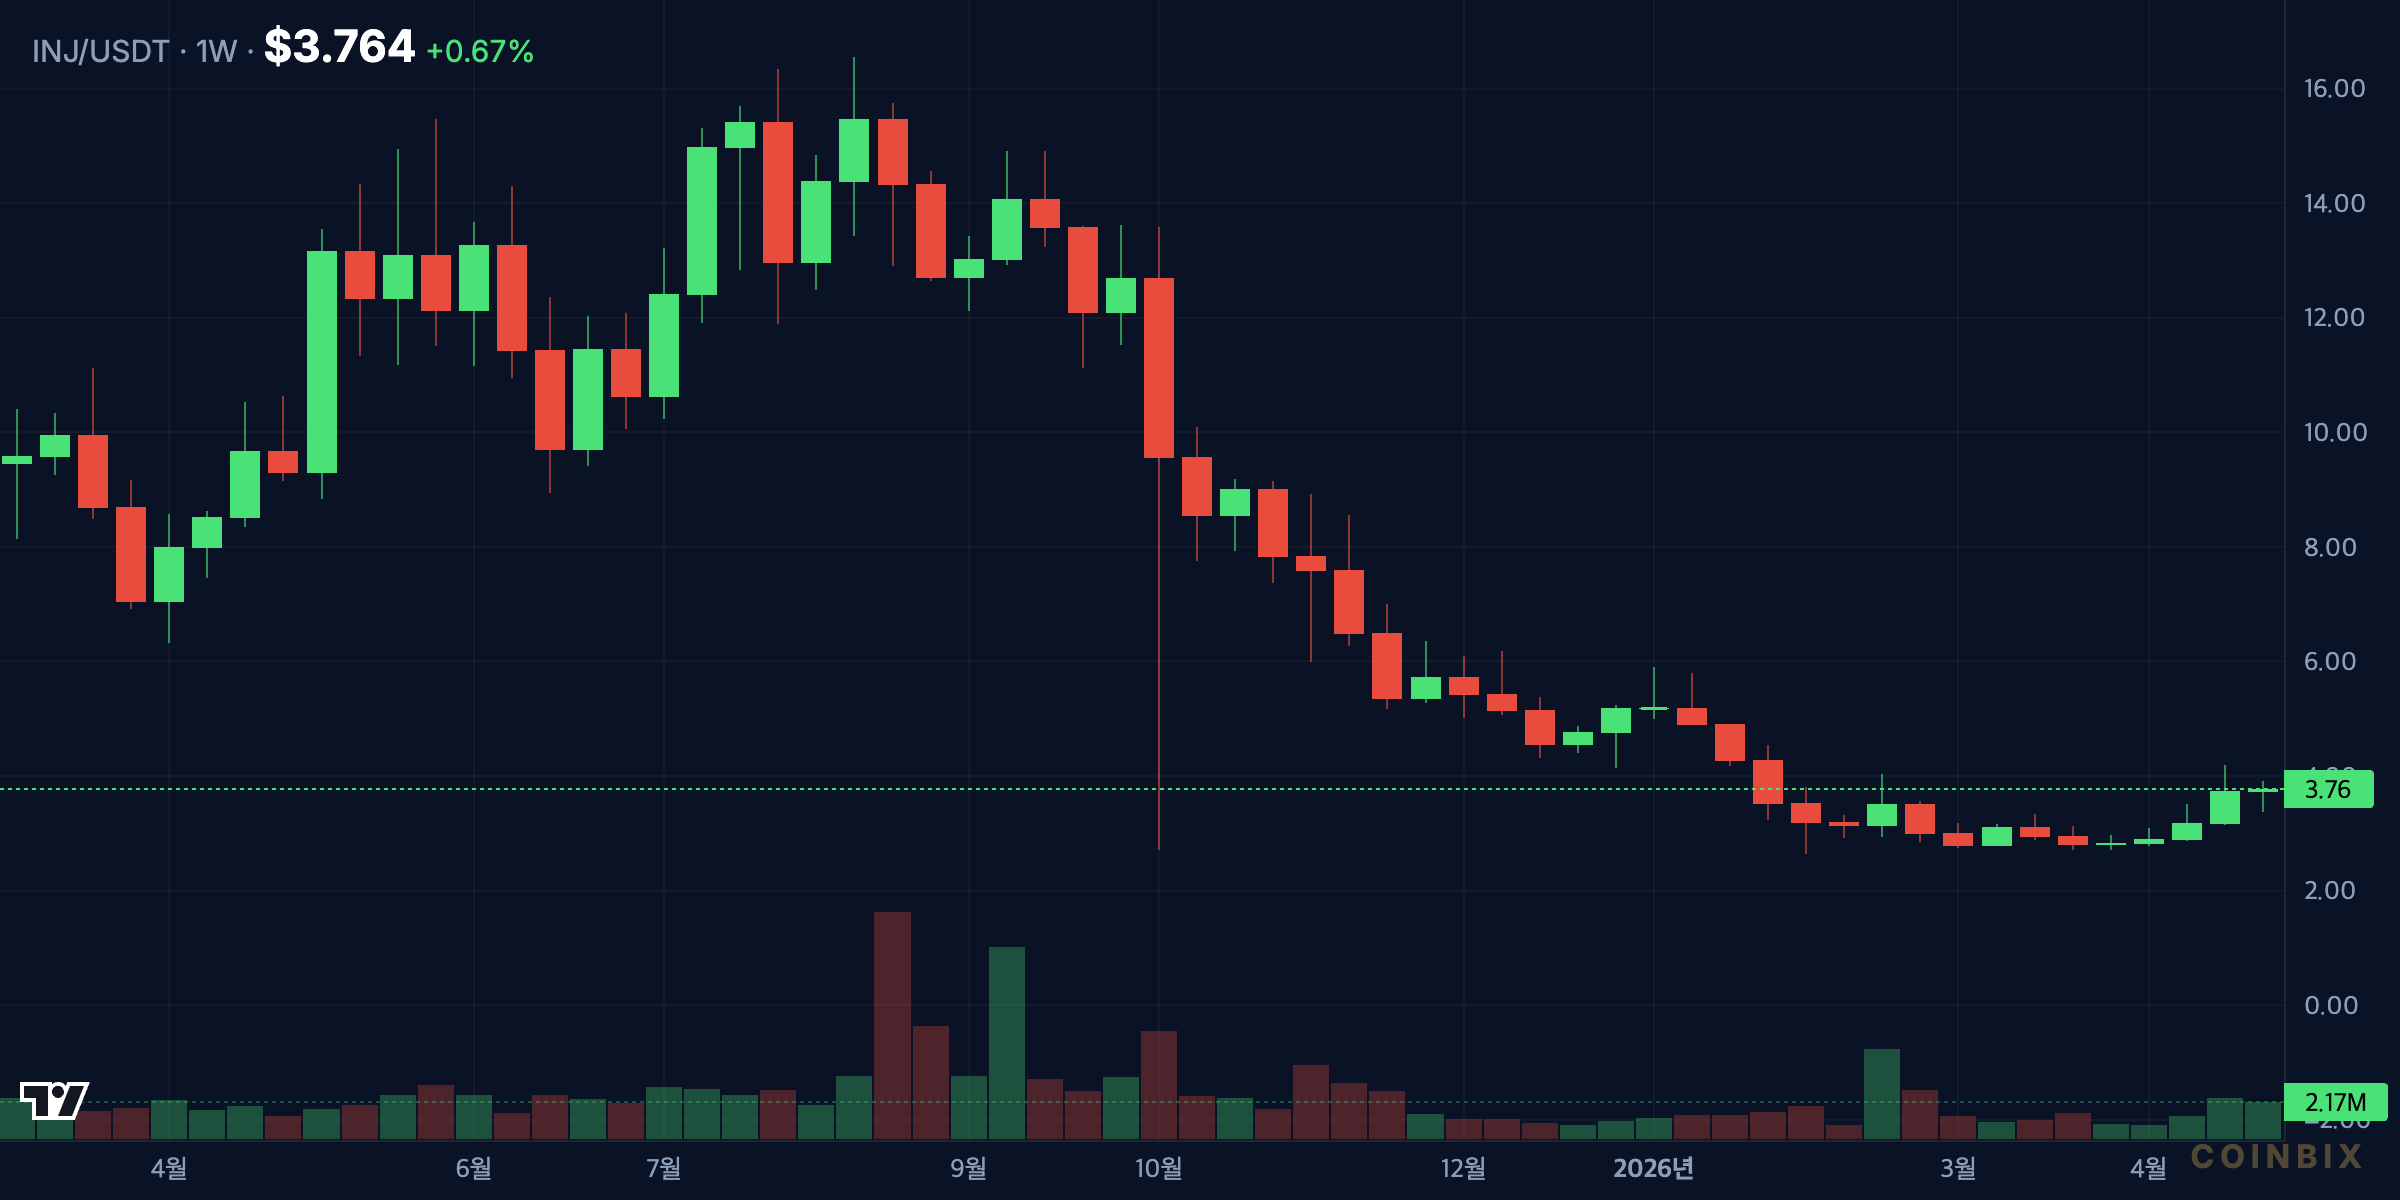
- ■ INJ trades near $3.76 with a $376 million market cap and $59.7 million in 24-hour volume, according to market data.
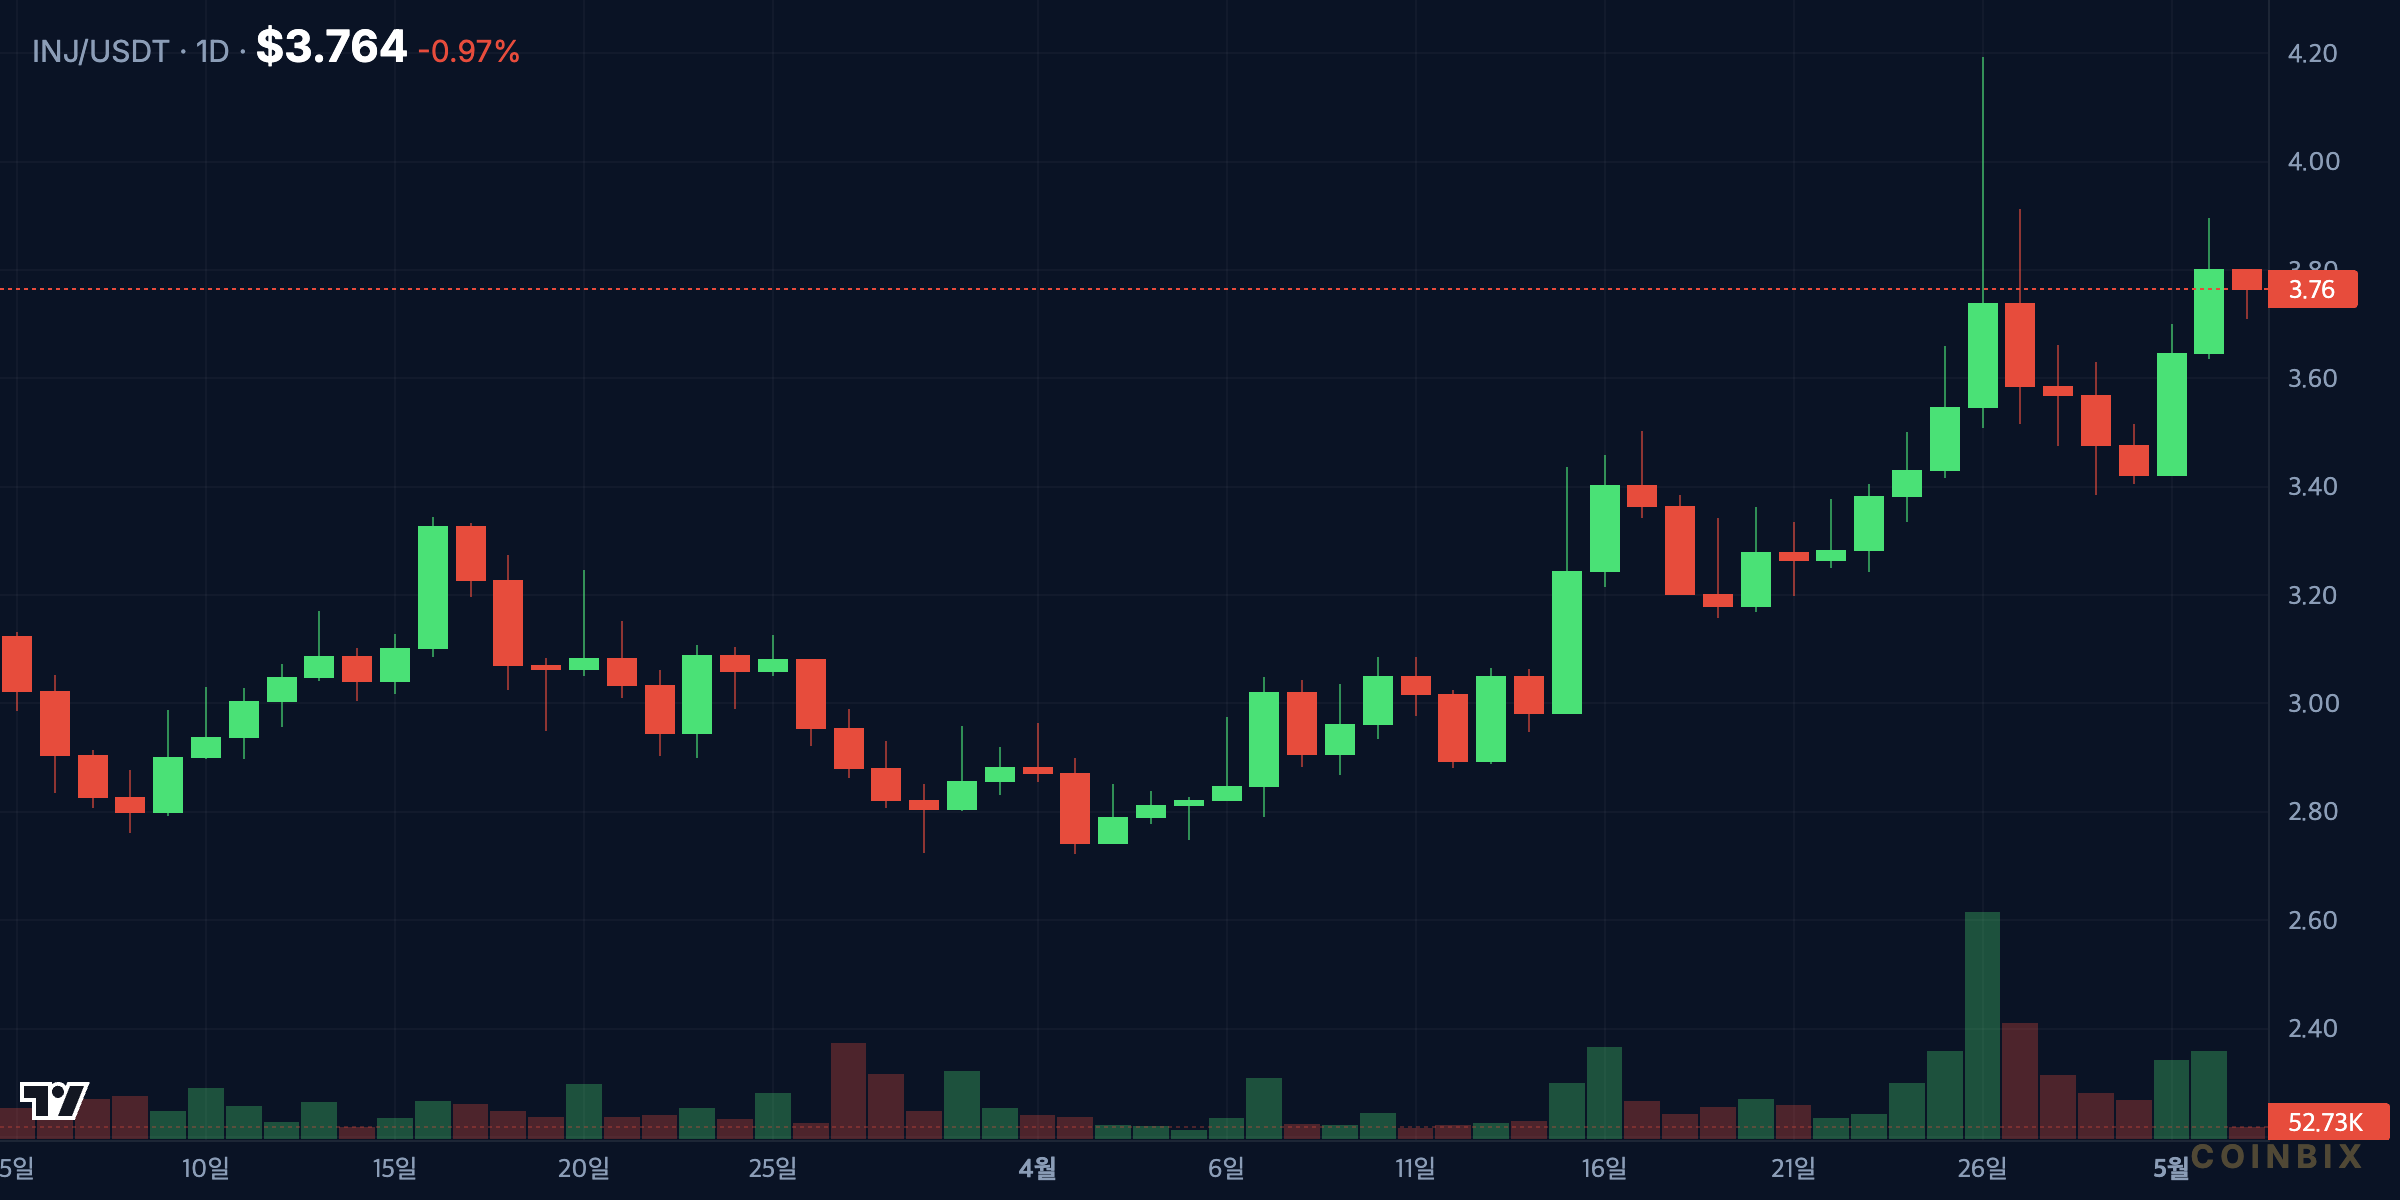
- ▼ The token remains 92.85% below its $52.62 all-time high, so the broader structure is still a recovery setup rather than a confirmed macro trend reversal.
Why INJ’s Channel Setup Matters Now
Injective is back on the radar because its recent price behavior looks less like a random bounce and more like the early stage of a structured recovery channel. INJ trades near $3.76, almost unchanged over both 24 hours and seven days, yet the token is up 32.75% over 30 days. That contrast matters: short-term momentum has cooled, but the monthly structure still shows demand rebuilding from lower levels.
For market-analysis readers, the key question is not whether INJ can return quickly to its former cycle high. A move back toward the $52.62 all-time high from March 2024 would require a major repricing of the entire Injective ecosystem. The more practical question is whether INJ can defend a higher-low structure and develop a second upward wave inside a rising channel.
That setup gives traders and investors a cleaner framework. If the channel holds, INJ can rotate from support toward resistance in stages. If it breaks, the 30-day rebound may be reclassified as a bear-market relief rally. The next few sessions around $3.50, $4.20, and $5.10 may define which interpretation dominates.
INJ Market Summary: Recovery, Not Euphoria
The current data shows a market trying to stabilize rather than a market in full speculative acceleration. INJ’s 24-hour change of -0.09% and seven-day change of -0.01% point to consolidation. The 30-day gain of 32.75%, however, indicates that buyers have already forced a meaningful repricing from recent lows.
Volume is also important. At $59.7 million in 24-hour turnover, INJ has enough activity to validate technical levels, but the volume profile does not yet suggest a broad panic bid or institutional-style accumulation surge. A healthier bullish continuation would ideally show expanding volume on advances and softer volume during pullbacks. That pattern would signal that buyers are paying up during strength while sellers are losing urgency during dips.
The supply profile is straightforward but still relevant. Market data lists 100 million INJ circulating and 100 million total supply, while max supply is shown as unlimited. This means valuation analysis should focus less on a simple capped-supply narrative and more on network usage, fee capture, staking participation, token utility, and the market’s willingness to assign a premium to Injective’s role in decentralized finance infrastructure.
What Does the INJ Channel Show?
The emerging INJUSD channel can be read as a controlled recovery structure. In this framework, the lower boundary is where buyers repeatedly step in, while the upper boundary is where short-term holders take profit. A valid channel does not require price to move straight upward. In fact, the best channels often include pullbacks, retests, and pauses that reset momentum before the next leg.
Near $3.76, INJ is positioned in the middle zone of the structure. That location is important because it is less attractive for aggressive risk-taking than a lower-channel retest, but it is also not extended enough to imply immediate exhaustion. The tactical signal now comes from whether INJ can hold above the $3.45-$3.55 support area and then reclaim the $4.20-$4.35 band.
A break above $4.35 would strengthen the case for a second wave toward $5.10. Beyond that, $6.40 becomes the next broader resistance zone, especially if the move is supported by rising volume and a constructive market backdrop for altcoins. If INJ fails at $4.20 and loses $3.45, the channel would weaken and price could revisit $3.00 or even the $2.80-$2.85 demand region.
Support and Resistance Levels to Watch
The first support zone sits around $3.45-$3.55. This area matters because it represents the near-term line between constructive consolidation and a failed breakout attempt. If INJ holds this zone, traders can continue to treat dips as potential higher-low opportunities within the recovery channel.
The second support zone is near $3.00. A move into this region would not automatically destroy the longer recovery thesis, but it would show that buyers have lost short-term control. The deeper structural support sits around $2.80-$2.85. A daily close below that area would be more damaging because it would suggest the 30-day rebound has lost its base.
On the upside, the first resistance band is $4.20-$4.35. This is the level INJ needs to clear to convert sideways consolidation into a stronger continuation signal. The second resistance is near $5.10, which may act as the first meaningful target if a new wave develops. The third zone is around $6.40, where a larger recovery attempt would likely face heavier profit-taking.
These levels should not be treated as exact predictions. They are decision zones. The market’s reaction at each zone matters more than the number itself. A strong close above resistance with rising volume carries more weight than an intraday wick. Likewise, a brief dip below support that quickly reverses can be less bearish than a slow grind lower on expanding sell volume.
EMA, RSI, and Volume: Is Momentum Improving?
The moving-average picture is best viewed as transitional. In a clean bullish reversal, shorter EMAs begin to flatten, then turn higher, and eventually cross above longer EMAs. INJ’s 30-day rebound suggests that shorter-term averages are likely improving, but the token still needs follow-through to confirm that the trend has shifted from recovery to expansion.
The $4.20-$4.35 zone is especially useful for EMA analysis. If price pushes through that region and remains above it, shorter moving averages may begin to act as dynamic support. That would help validate the channel. If price rejects there and closes back below the mid-channel area, the market may interpret the recent rebound as overextended.
RSI should be read in the same balanced way. A neutral-to-improving RSI profile would be constructive because it shows momentum rebuilding without immediate overheating. A sharp RSI spike above overbought territory before price clears resistance would be less attractive, as it could signal a fast move vulnerable to a pullback. The ideal bullish case is steady RSI improvement paired with higher lows in price.
Volume remains the confirmation tool. INJ’s $59.7 million 24-hour volume provides liquidity, but the next wave requires quality volume, not just headline turnover. A breakout with low volume would be easier to fade. A breakout with rising spot demand and broad market participation would carry more weight.
Injective Ecosystem: Why Fundamentals Still Matter
Injective is not only a price chart. It is a layer-1 blockchain designed around decentralized finance, exchange infrastructure, and interoperable markets. The official Injective ecosystem has continued to build through the bear cycle, and that context matters when evaluating whether a technical channel can sustain itself.
The network’s core value proposition centers on on-chain order books, cross-chain trading, and developer tooling for custom DeFi applications. If adoption metrics — total value locked, active addresses, transaction throughput — improve alongside price, the channel setup becomes more credible. If price rises while on-chain activity stagnates, the structure is more fragile.
Injective’s position within the Cosmos ecosystem also provides interoperability advantages. Cross-chain bridges and IBC connectivity allow INJ to participate in broader DeFi flows rather than remaining isolated. That ecosystem depth can attract both developers and liquidity, which in turn supports the kind of sustained demand that a recovery channel needs.
Institutional interest is harder to measure directly, but token listings, custody support, and inclusion in regulated products all contribute to market perception. INJ’s presence on major exchanges and its $376 million market cap provide a baseline of accessibility. Whether that translates into sustained accumulation depends on broader market conditions and Injective’s ability to differentiate from competing layer-1 networks.
Channel Scenarios: What Comes Next?
The most constructive scenario sees INJ defend the $3.45-$3.55 support, push through $4.20-$4.35, and begin a second wave toward $5.10. In this case, the channel becomes a roadmap: each higher low confirms the structure, and each resistance test provides a new decision point. Volume expansion and improving on-chain metrics would reinforce the bullish case.
A neutral scenario plays out if INJ remains range-bound between $3.45 and $4.20 for an extended period. This would not invalidate the channel, but it would delay wave development and test trader patience. Consolidation can be constructive if it absorbs selling pressure and builds a base, but it can also precede a breakdown if demand fades.
The bearish scenario triggers if INJ loses $3.45 and fails to recover quickly. In that case, the 30-day rebound would look more like a relief rally within a larger corrective structure. The $3.00 and $2.80-$2.85 levels would then come into play, and the channel thesis would need to be reassessed.
Regardless of which scenario unfolds, the channel framework gives traders a structured way to manage risk. Entries near the lower boundary offer better risk-reward than chasing at resistance. Stop-losses below the channel floor protect against breakdowns. And position sizing should reflect the fact that INJ, despite its recovery, remains 92.85% below its all-time high.
Risk Factors to Consider
No analysis is complete without acknowledging the downside risks. INJ’s distance from its all-time high reflects both broader market conditions and project-specific challenges. The DeFi sector remains competitive, and Injective must continue to attract users and developers to justify its valuation.
Regulatory uncertainty is another factor. As governments worldwide develop frameworks for decentralized finance, projects like Injective face the risk of compliance requirements that could affect operations or token economics. While Injective’s decentralized architecture provides some resilience, regulatory headwinds remain a consideration for any DeFi-focused network.
Market correlation is also important. INJ, like most altcoins, tends to correlate with Bitcoin and broader crypto market sentiment. A significant BTC downturn could drag INJ lower regardless of its individual technical setup. Traders should monitor the overall market environment alongside INJ-specific levels.
Related market reads: Three Bitcoin Charts Signal BTC Price Rebound to $82K and Bitcoin Slides as $100 Oil Raises Asia Stress.
Frequently Asked Questions
What is the current INJ price and market cap?
INJ trades near $3.76 with a market capitalization of approximately $376 million, according to public data. The token has a circulating supply of 100 million INJ.
Is INJ in a bullish channel?
INJ is showing early channel behavior after a 32.75% 30-day recovery. The channel requires confirmation through a clean move above the $4.20-$4.35 resistance band and defense of the $3.45-$3.55 support zone.
What are the key support and resistance levels for INJ?
Support levels: $3.45-$3.55 (near-term), $3.00 (secondary), $2.80-$2.85 (structural). Resistance levels: $4.20-$4.35 (first barrier), $5.10 (wave target), $6.40 (broader resistance).
How far is INJ from its all-time high?
INJ’s all-time high was $52.62, reached on March 14, 2024. The current price of $3.76 represents a 92.85% decline from that peak.
What drives INJ’s value beyond price speculation?
Injective’s value proposition centers on its layer-1 blockchain for DeFi, on-chain order books, cross-chain trading via Cosmos IBC, and developer tooling for custom financial applications. Network adoption, TVL, and active addresses are key fundamental metrics to watch.
Where is INJ available?
INJ is available on major cryptocurrency exchanges. You can trade INJ with competitive fees on Bybit, which offers spot and derivatives markets for INJ trading pairs.
Affiliate Disclosure: This page contains affiliate links. Coinbix may earn a commission at no extra cost to you.
Disclaimer: This article is for informational purposes only and does not constitute financial advice. Cryptocurrency investments carry significant risk. Always conduct your own research before making investment decisions.