Key Takeaways
- ▼ SOL is trading near $84.8, below the daily EMA 50 near $86.1 and far below the daily EMA 200 near $116.8, leaving the broader trend vulnerable.
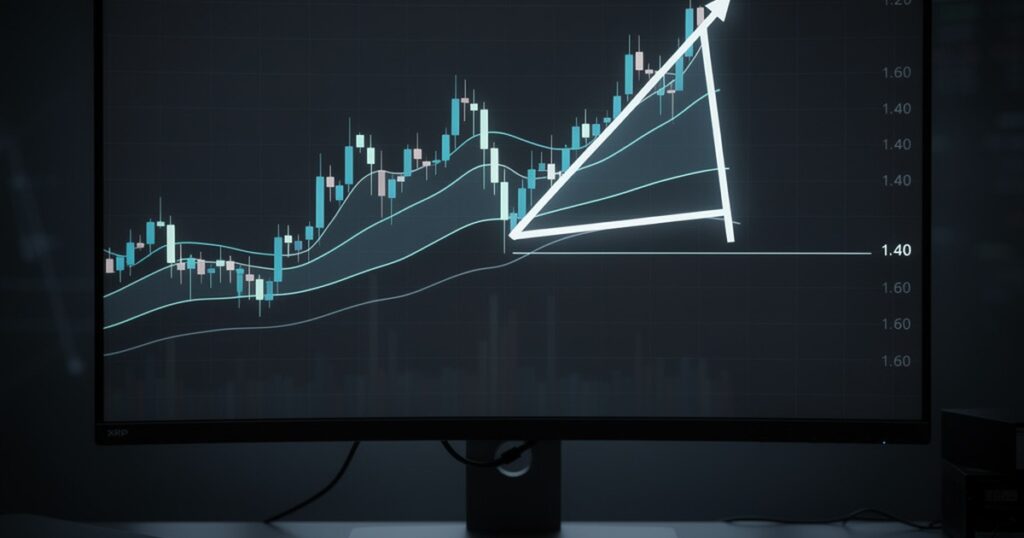
- ▲ The 4-hour chart has stabilized above the $83.3-$81.4 demand zone, so a short squeeze can still develop if price reclaims $88-$90 with volume.
- ■ Weekly momentum remains soft, with RSI near 35 and a wide $67-$149 20-week range that argues for patience around breakout claims.
Solana is at a technically important point. Short-term candles are defending the mid-$80 area while daily and weekly trend measures still lean bearish. According to current market data, SOL recently traded around $84.84, with a market capitalization near $48.9 billion and roughly $3.1 billion in 24-hour spot volume. Liquidity is deep, but liquidity alone does not repair a damaged trend.
The key question for market participants is whether SOL is forming a durable base or simply pausing after a failed recovery channel. The answer depends less on one candle and more on how price behaves around $81-$83 support, $88-$90 resistance, and the larger $98-$100 recovery threshold. If buyers cannot move price above those levels, the chart remains exposed to a deeper retest toward the high-$70s and potentially the weekly range floor near $67.
What does SOL need to hold now?
The near-term battleground is the 4-hour SOLUSDT chart (Binance price feed). Perpetual market data showed SOL near $84.8, with the latest 4-hour range compressed between roughly $84.7 and $84.8 after a broader 20-candle range from $83.27 to $85.89. That compression matters because it follows a larger 50-candle range between $81.35 and $88.07. In simple terms, SOL is trading in the upper half of its short-term support band, but it has not yet escaped the overhead supply created by the failed recovery attempt.
On the 4-hour timeframe, the EMA stack is mixed but not convincingly bullish. The 20-period EMA is near $84.20, the 50-period EMA is near $84.37, and the 200-period EMA is near $85.14. Price holding above the 20 and 50 EMAs gives short-term buyers a tactical foothold. However, the 200 EMA is still slightly overhead, so the chart has not fully flipped into a clean momentum regime. A decisive 4-hour close above $85.90 would be the first constructive step; a stronger signal would require acceptance above $88.00, where the 50-candle range high sits.
Support is clearer. The first defense is $83.30, the recent 4-hour low. Below that, $81.35 is the level that would likely decide whether the current base remains valid. If SOL loses $81.35 on rising turnover, the market would be confirming that the short-term channel has failed and that dip buyers are no longer absorbing supply. The next technical magnets would then be $78-$77, followed by the wider daily low near $76.64.
Momentum is not extreme. The 4-hour RSI is near 60, which means there is room for a push higher, but it is not the kind of deeply oversold reading that normally marks panic exhaustion. The 4-hour ATR is around $0.75, so a normal intraday move can quickly test either side of the current narrow range. That makes the next breakout or breakdown more important than the current candle body.
Daily EMA structure keeps the larger trend defensive
The daily chart is less forgiving than the 4-hour chart. Based on derivatives market data, SOL recently printed a daily candle with a low near $83.30, a high near $85.89, and a close near $84.77. The daily EMA 20 is near $84.68, which means price is almost exactly on the short-term trend line. The problem is the daily EMA 50 near $86.08 and the EMA 200 near $116.83. A token trading near its EMA 20 but below its EMA 50 and far below its EMA 200 is not in a confirmed recovery trend; it is in a contested rebound inside a larger downtrend.
The daily range data reinforces that point. Over the latest 20 daily candles, SOL traded between $81.35 and $90.72. Over the latest 50 daily candles, the range stretched from $76.64 to $97.68. Those levels create a clean map. Below $81.35, the market starts looking back toward $76.64. Above $90.72, SOL can argue that the recent lower-high structure is weakening. Above $97.68, the chart would finally be reclaiming the top of its 50-day range and forcing bearish positioning to reassess.
Volume does not yet confirm aggressive accumulation. The latest daily futures volume was about 3.67 million SOL versus a 20-day average near 7.14 million SOL. A recovery attempt on below-average volume can continue, but it usually needs follow-through quickly. Otherwise, it risks becoming a low-conviction bounce that fades when price approaches resistance. For SOL, that means $86-$88 is not just a price zone; it is a test of whether buyers are willing to pay up after the first rebound.
Daily RSI near 47 also supports a neutral-to-defensive reading. It is not deeply oversold, and it is not showing a strong momentum breakout. The market is balanced enough for a tactical rally, but the burden of proof remains on buyers. A daily close below $83 would likely turn the balance back toward sellers. A daily close above $90.72 would improve the structure, but the more important medium-term line remains $97.68-$100.
Why does the weekly chart matter more than the bounce?
Short-term traders can focus on the $81-$90 zone, but the weekly chart explains why the market has been reluctant to price SOL as a clean recovery. The weekly EMA 20 is near $99.52, and the weekly EMA 50 is near $126.89. SOL trading below both tells institutional-style allocators that momentum is still in repair mode, not expansion mode. A recovery back to $100 would be important because it would bring price back toward the weekly EMA 20. A recovery above $127 would be a much larger trend signal because it would reclaim the weekly EMA 50.
The weekly range is wide and volatile. Over the latest 20 weekly candles, SOL traded from about $67.31 to $148.95. Over the latest 50 weekly candles, the range expanded from $67.31 to $253.40. That means the market has already repriced Solana from a high-beta winner into a more selective asset where buyers demand stronger confirmation. Weekly RSI near 35 is weak, but not necessarily washed out. It suggests bearish pressure has been persistent, while also leaving room for a relief rally if macro and crypto liquidity improve.
The weekly ATR near $12.46 is another important point. A $10-$13 weekly move in SOL is normal in the current volatility regime. Therefore, a move from $85 to $76 would not be an extraordinary crash; it would be a one-ATR extension. Likewise, a rally from $85 to $98 would also fit within normal volatility. The analyst’s job is not to overreact to either move, but to ask whether the close confirms a new structure. For now, the close has not.
Derivatives positioning: neutral funding, meaningful open interest
Derivatives data adds nuance. The SOLUSDT perpetual ticker showed open interest around 6.65 million SOL, with open interest value near $563.8 million. Funding was slightly positive, around 0.0017% at the snapshot, while recent funding prints moved between mildly negative and mildly positive. That is not an overheated long market, and it is not a crowded short market either. It is closer to a two-sided market waiting for confirmation.
This setup can create sharp moves in both directions. If SOL breaks below $81.35 while open interest remains elevated, stop-loss selling and fresh shorts may accelerate a move toward $76-$78. If SOL instead reclaims $88-$90 with a funding rate that remains modest, the rally could squeeze late shorts without immediately becoming overheated. The derivatives message is therefore not simply bearish. It is conditional: the next directional move can travel quickly because positioning is large enough to matter, but funding is not extreme enough to give a contrarian signal by itself.
Macro conditions are not a tailwind yet
Solana does not trade in isolation. High-beta crypto assets often respond to global liquidity, real yields, the dollar, and broad risk appetite. The latest public FRED 10-year Treasury yield reading was near 4.40% on April 30. The broad dollar index tracked by FRED DTWEXBGS was near 118.73 on April 24. Those levels do not automatically force SOL lower, but they are not an obvious liquidity tailwind for speculative assets either.
When yields stay firm, investors tend to demand cleaner evidence before rotating into high-beta tokens. That helps explain why SOL can hold near $85 without attracting a decisive breakout bid. The network may remain fundamentally relevant, but the price chart still needs liquidity confirmation. In this environment, technical resistance levels carry more weight because macro is not providing a broad risk-on impulse strong enough to override weak trend structure.
Bull and bear scenarios for SOL price
The bearish scenario starts with a failure to hold $83.30, followed by a daily close below $81.35. That would confirm a loss of the short-term base and expose the $78-$76.64 support pocket. If that area fails, the weekly range floor near $67.31 becomes the next major downside reference. A move into that zone would not require a new fundamental shock; it could unfold as a technical continuation while price remains below the daily EMA 50 and weekly EMA 20.
The neutral scenario is continued rotation between $81 and $90. This would frustrate both trend followers and late breakout traders. In that case, the best signal would be volume behavior. If downside tests keep producing weak sell volume and quick recoveries, the base becomes stronger. If upside tests toward $88-$90 keep producing fading volume and long upper wicks, sellers retain control.
The bullish scenario requires SOL to reclaim $90.72 first, then push toward $97.68-$100. That would shift the daily chart from failed bounce risk to range breakout risk. A close above $100 would also reconnect price with the weekly EMA 20 area, improving the medium-term outlook. The stronger confirmation would be a weekly close above $100 with expanding volume, followed by acceptance above $116-$127. Until then, any bullish view should be treated as tactical rather than structural.
Conclusion: SOL is stable, but not confirmed bullish
SOL’s current price action is best described as a fragile stabilization, not a confirmed reversal. The 4-hour chart shows buyers defending the mid-$80s, but the daily chart still sits below key moving averages, and the weekly chart remains below its primary trend lines. That creates a market where risk is two-sided, but downside confirmation would become serious below $81.35.
For traders and allocators, the practical map is straightforward. Above $88-$90, SOL can attempt a recovery toward $98-$100. Below $81.35, the probability of a move toward $76 and then $67 increases. Between those levels, the market is still deciding whether the failed channel becomes a larger breakdown or a noisy base before a stronger recovery attempt.
Related market reads: Three Bitcoin Charts Signal BTC Price Rebound to $82K and Bitcoin Slides as $100 Oil Raises Asia Stress.
FAQ
What is the most important SOL support level?
The most important near-term support is $81.35. It marks the lower boundary of the recent 4-hour and 20-day structure. A daily close below that level would increase downside risk toward $78-$76.64.
What resistance must SOL reclaim to improve the trend?
SOL first needs to reclaim $88-$90, then $97.68-$100. The $100 area matters because it aligns with the weekly EMA 20 zone and would signal a stronger recovery attempt.
Is SOL oversold on the daily chart?
Not strongly. Daily RSI is near 47, which is closer to neutral than oversold. Weekly RSI near 35 is weaker, but it does not by itself confirm a durable bottom.
Why are EMAs important for this SOL analysis?
EMAs help measure trend pressure across timeframes. SOL is near its daily EMA 20 but below the daily EMA 50 and far below the daily EMA 200, so the broader trend remains defensive.
Can SOL still recover if the weekly chart is weak?
Yes, but the recovery needs confirmation. A move above $90 can start a tactical rebound, while a weekly close above $100 would make the recovery more credible.
Affiliate Disclosure: This page contains affiliate links. Coinbix may earn a commission at no extra cost to you.
Disclaimer: This article is for informational purposes only and does not constitute financial advice. Cryptocurrency investments carry significant risk. Always conduct your own research before making investment decisions.