Key Takeaways
- ▲ Bitcoin is holding an ascending channel, with repeated rebounds from the $76,800-$77,500 support zone.
- ▲ Binance stablecoin inflows of about $6 billion across March and April suggest liquidity is returning.
- ■ The next decisive test is near $79,000, where recent investor cost basis may cap momentum.
Affiliate Disclosure
This article may include partner links. Coinbix may receive compensation if users access partner services through these links.
Bitcoin’s Rebound Setup Is Back on the Table
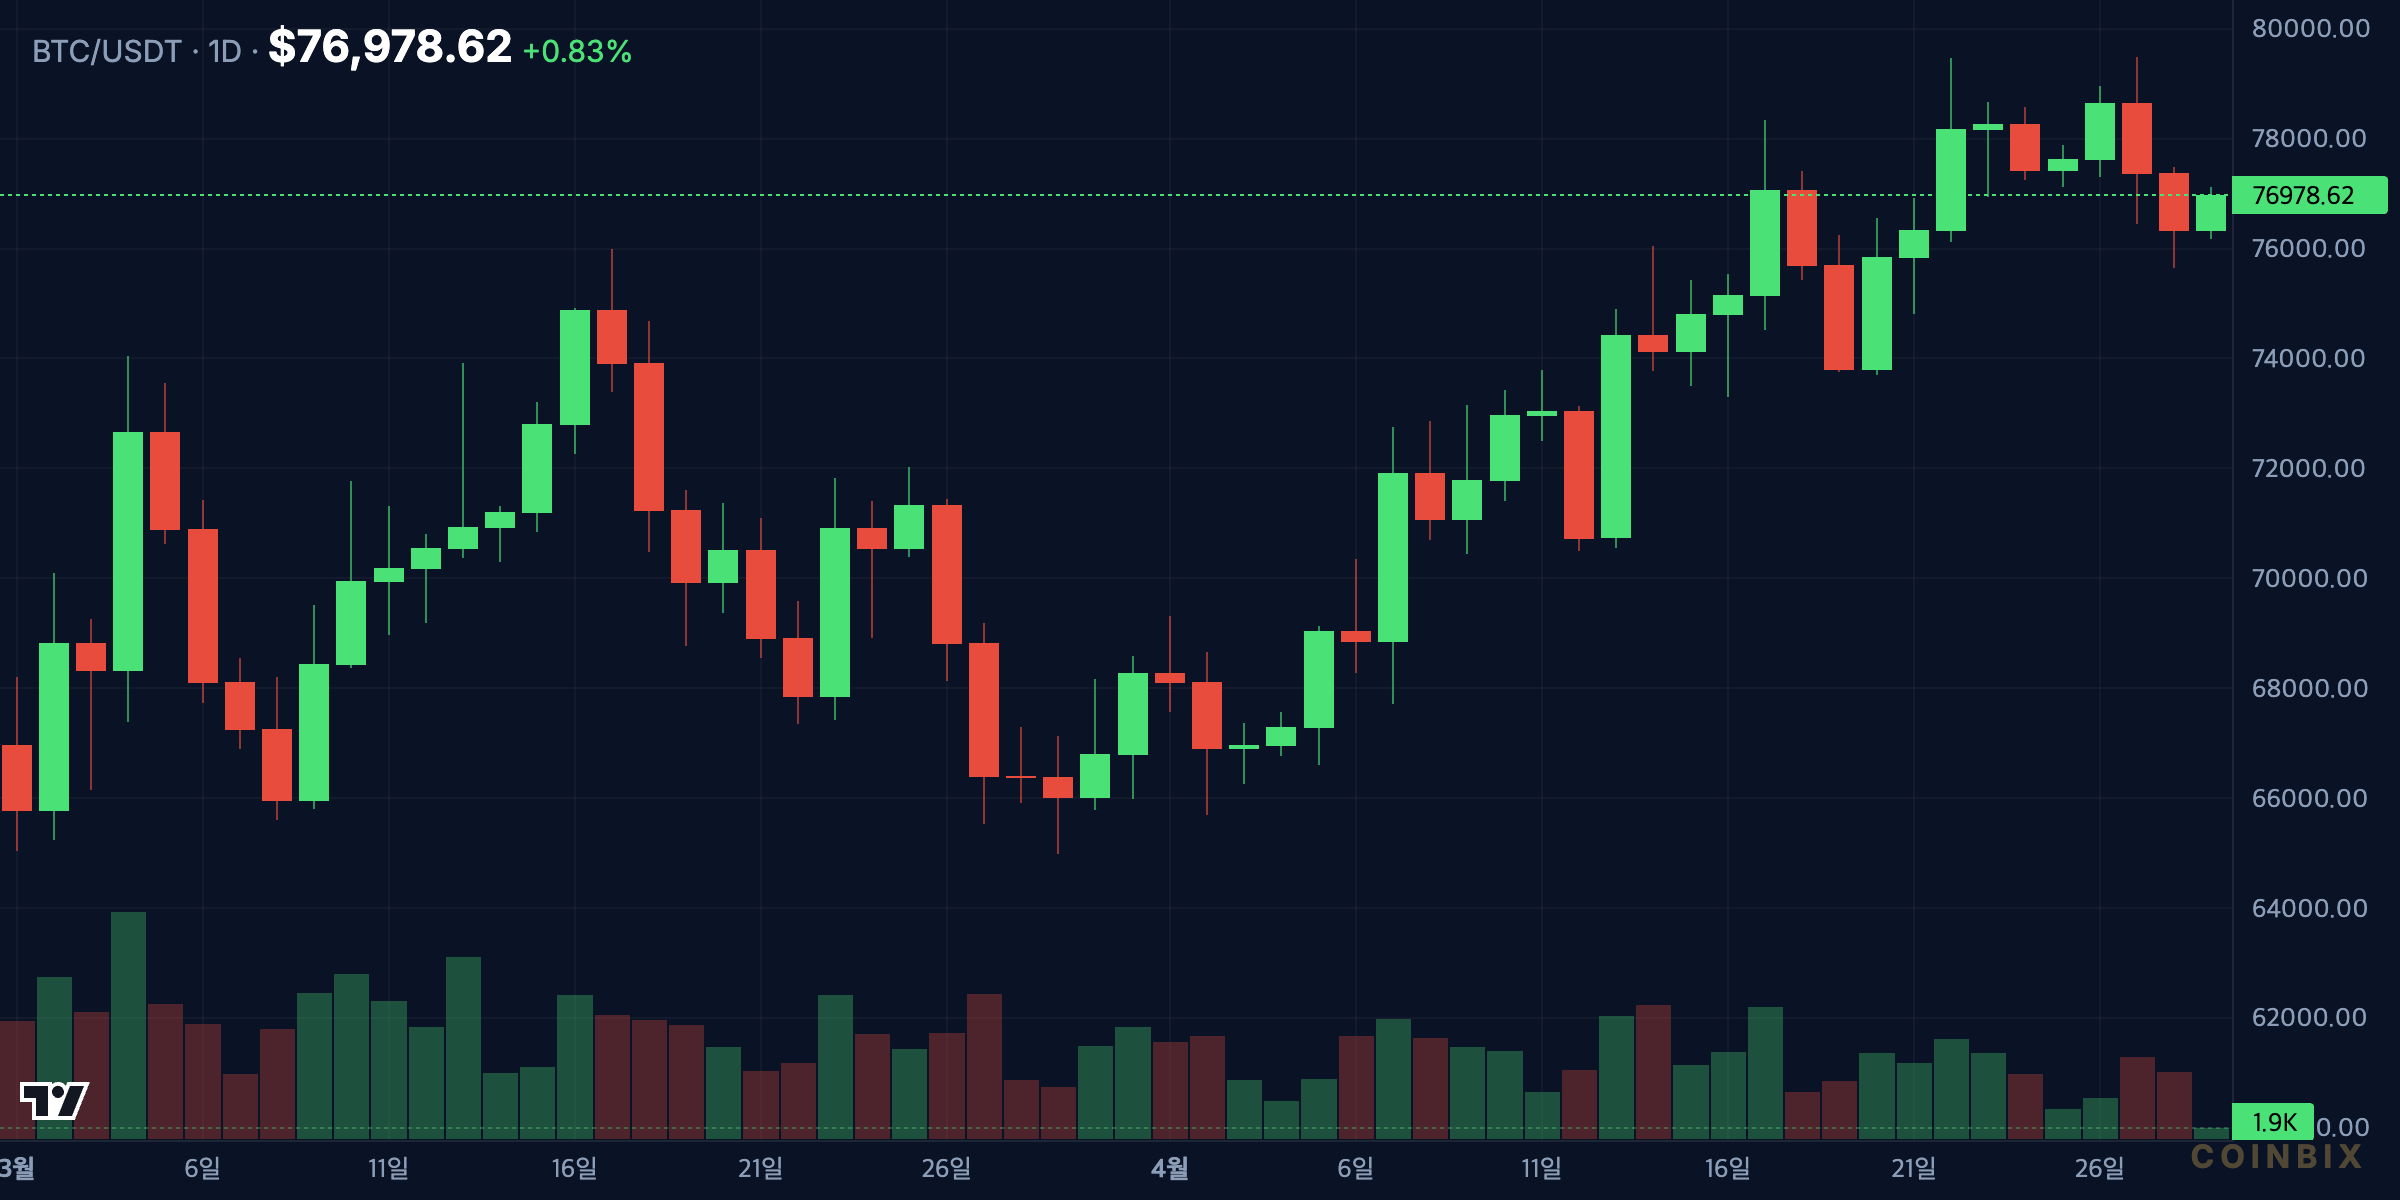
Bitcoin is again testing whether a short-term recovery structure can turn into a broader market rebound. According to Cointelegraph, BTC recently traded near $76,969 while three separate signals pointed toward a potential move to $82,700 and, under a stronger follow-through scenario, a higher target near $94,500.
The argument is not that Bitcoin has already escaped risk. It is that price structure, exchange liquidity, and on-chain valuation are now aligned more constructively than they were during the prior drawdown phase. For a global crypto audience, the key question is simple: can BTC clear the level where recent investors may start selling into strength?
Source and Timing Note
As of April 29, 2026, this article cross-checks the Cointelegraph chart setup against independent market references rather than relying on a single source. Spot-market context can be compared with CoinGecko Bitcoin data, exchange liquidity and BTC quote activity with Bybit BTC/USDT spot data, and on-chain valuation context with Glassnode Bitcoin metrics and IntoTheBlock Bitcoin analytics. Those references do not remove market risk, but they help separate a single-chart narrative from a broader evidence set.
What Do the Three Bitcoin Charts Show?
The first signal is technical. Bitcoin has been moving inside an ascending channel, with support clustered around $76,800-$77,500. Each recent test of the lower boundary reportedly triggered an 8%-10% rebound. That behavior matters because repeated defense of the same support zone often shows that buyers are not simply reacting once; they are stepping in at a level the market recognizes.
The upside target from this channel sits around $82,700, combining the upper boundary of the structure with the 1.618 Fibonacci extension. That level is close enough to be relevant for short-term positioning, but not so far that it requires a dramatic macro shift. The downside level to watch is $73,600, where the 0.786 Fibonacci retracement and 200-period four-hour EMA create a potential invalidation zone.

Liquidity Is Returning to Binance
The second chart focuses on stablecoin flows. Binance recorded roughly $6 billion in stablecoin inflows across March and April, including about $3.5 billion in April alone. That marks a reversal from the earlier $7.6 billion outflow period.
Stablecoin inflows do not guarantee immediate spot demand, but they often indicate that capital is moving back onto exchanges and becoming available for deployment. In Bitcoin markets, that liquidity backdrop can matter as much as chart structure. A breakout attempt without fresh liquidity is easier to fade; a breakout attempt with returning stablecoin balances has a stronger base to work from.
 Bybit 20% Fee Discount
Free Coinbix Premium Channel
Why Does the MVRV Signal Matter Now?
The third chart is on-chain valuation. Bitcoin has reclaimed the MVRV minus 0.5 standard deviation band near $72,750. In earlier bear-market fractals, including 2014 and 2018, reclaiming this band preceded rallies toward the MVRV mean band.
In the current setup, that mean-band target is estimated near $94,500. This does not mean BTC must reach that level in a straight line. It does, however, show why some analysts are paying attention to the recovery above $72,750: the signal has historically appeared when Bitcoin moved from deep-value conditions back toward a more balanced valuation zone.
The $79,000 Test May Decide the Next Move
The immediate obstacle is $79,000, described as the cost basis of recent investors. This level matters because holders who bought recently may use a return to breakeven as an opportunity to reduce exposure. That can create supply just as momentum starts to improve.
Analyst Willy Woo assigned a 30% probability to Bitcoin breaking through this level on the current attempt. That figure keeps the setup grounded. The charts are constructive, but the market still needs confirmation. A clean move through $79,000 would strengthen the case for $82,700. Failure there would keep BTC vulnerable to a retest of lower support, especially if price loses the $76,800-$77,500 zone.
Outlook: Constructive, but Not Confirmed
Bitcoin’s current setup is best read as a rebound attempt with improving evidence, not a completed breakout. The channel structure supports a move toward $82,700, Binance stablecoin inflows show returning liquidity, and the MVRV recovery adds a longer-term valuation signal.
The risk is that recent investor supply near $79,000 slows the move before it develops. Until BTC clears that area, the market remains in a testing phase. Above it, the $82,700 target becomes more credible. Below $76,800, attention shifts back to $73,600 as the level that could decide whether this rebound thesis stays intact.
Bybit 20% Fee Discount
Free Coinbix Premium Channel
How Traders Can Read the Setup
A practical reading of this setup should start with confirmation rather than prediction. If BTC holds the $76,800-$77,500 area and then accepts above $79,000 on stronger volume, the $82,700 channel target becomes a cleaner tactical level. If price only wicks above $79,000 and quickly returns below it, the move is more likely to be a liquidity sweep than a confirmed breakout. That distinction matters because rebound trades often fail when the market mistakes a brief stop-run for sustained demand.
Risk management also matters more than the headline target. The same chart that supports an upside path toward $82,700 also gives clear invalidation markers. A loss of the lower channel would weaken the bullish case, while a deeper move toward $73,600 would suggest that liquidity inflows and MVRV recovery are not yet strong enough to absorb selling. For long-term holders, the signal is constructive; for leveraged traders, it remains a confirmation trade, not a certainty.
FAQ
What is the main Bitcoin rebound target?
The near-term upside target is around $82,700, based on the upper boundary of Bitcoin’s ascending channel and the 1.618 Fibonacci extension.
What Bitcoin support level matters most?
The key support zone is $76,800-$77,500. If Bitcoin loses that area, the next downside level cited in the setup is around $73,600.
Why is $79,000 important for BTC?
$79,000 is viewed as the cost basis of recent investors. A break above it could improve momentum, while rejection may bring renewed selling pressure.
Affiliate Disclosure: This page contains affiliate links. Coinbix may earn a commission at no extra cost to you.
Disclaimer: This article is for informational purposes only and does not constitute financial advice. Cryptocurrency investments carry significant risk. Always conduct your own research before making investment decisions.