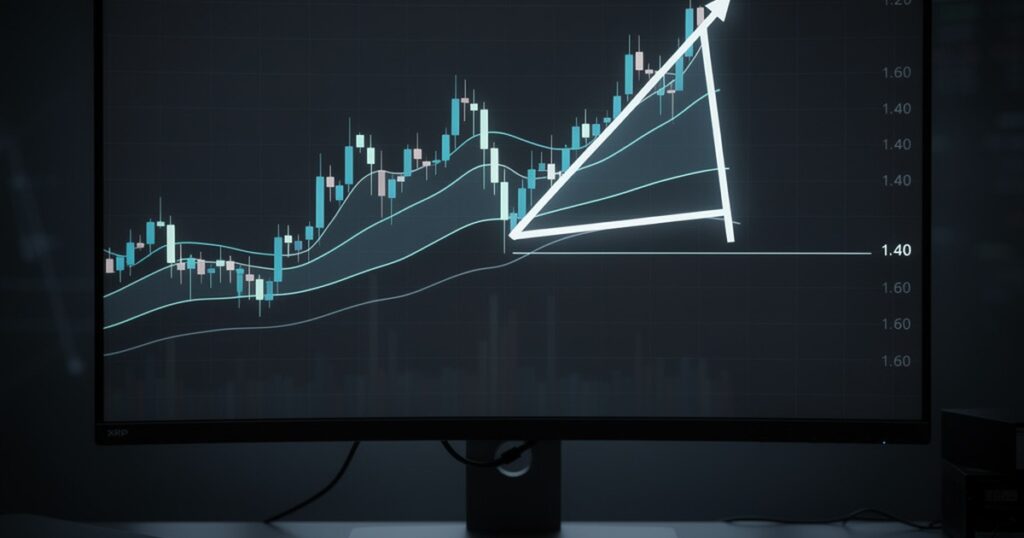
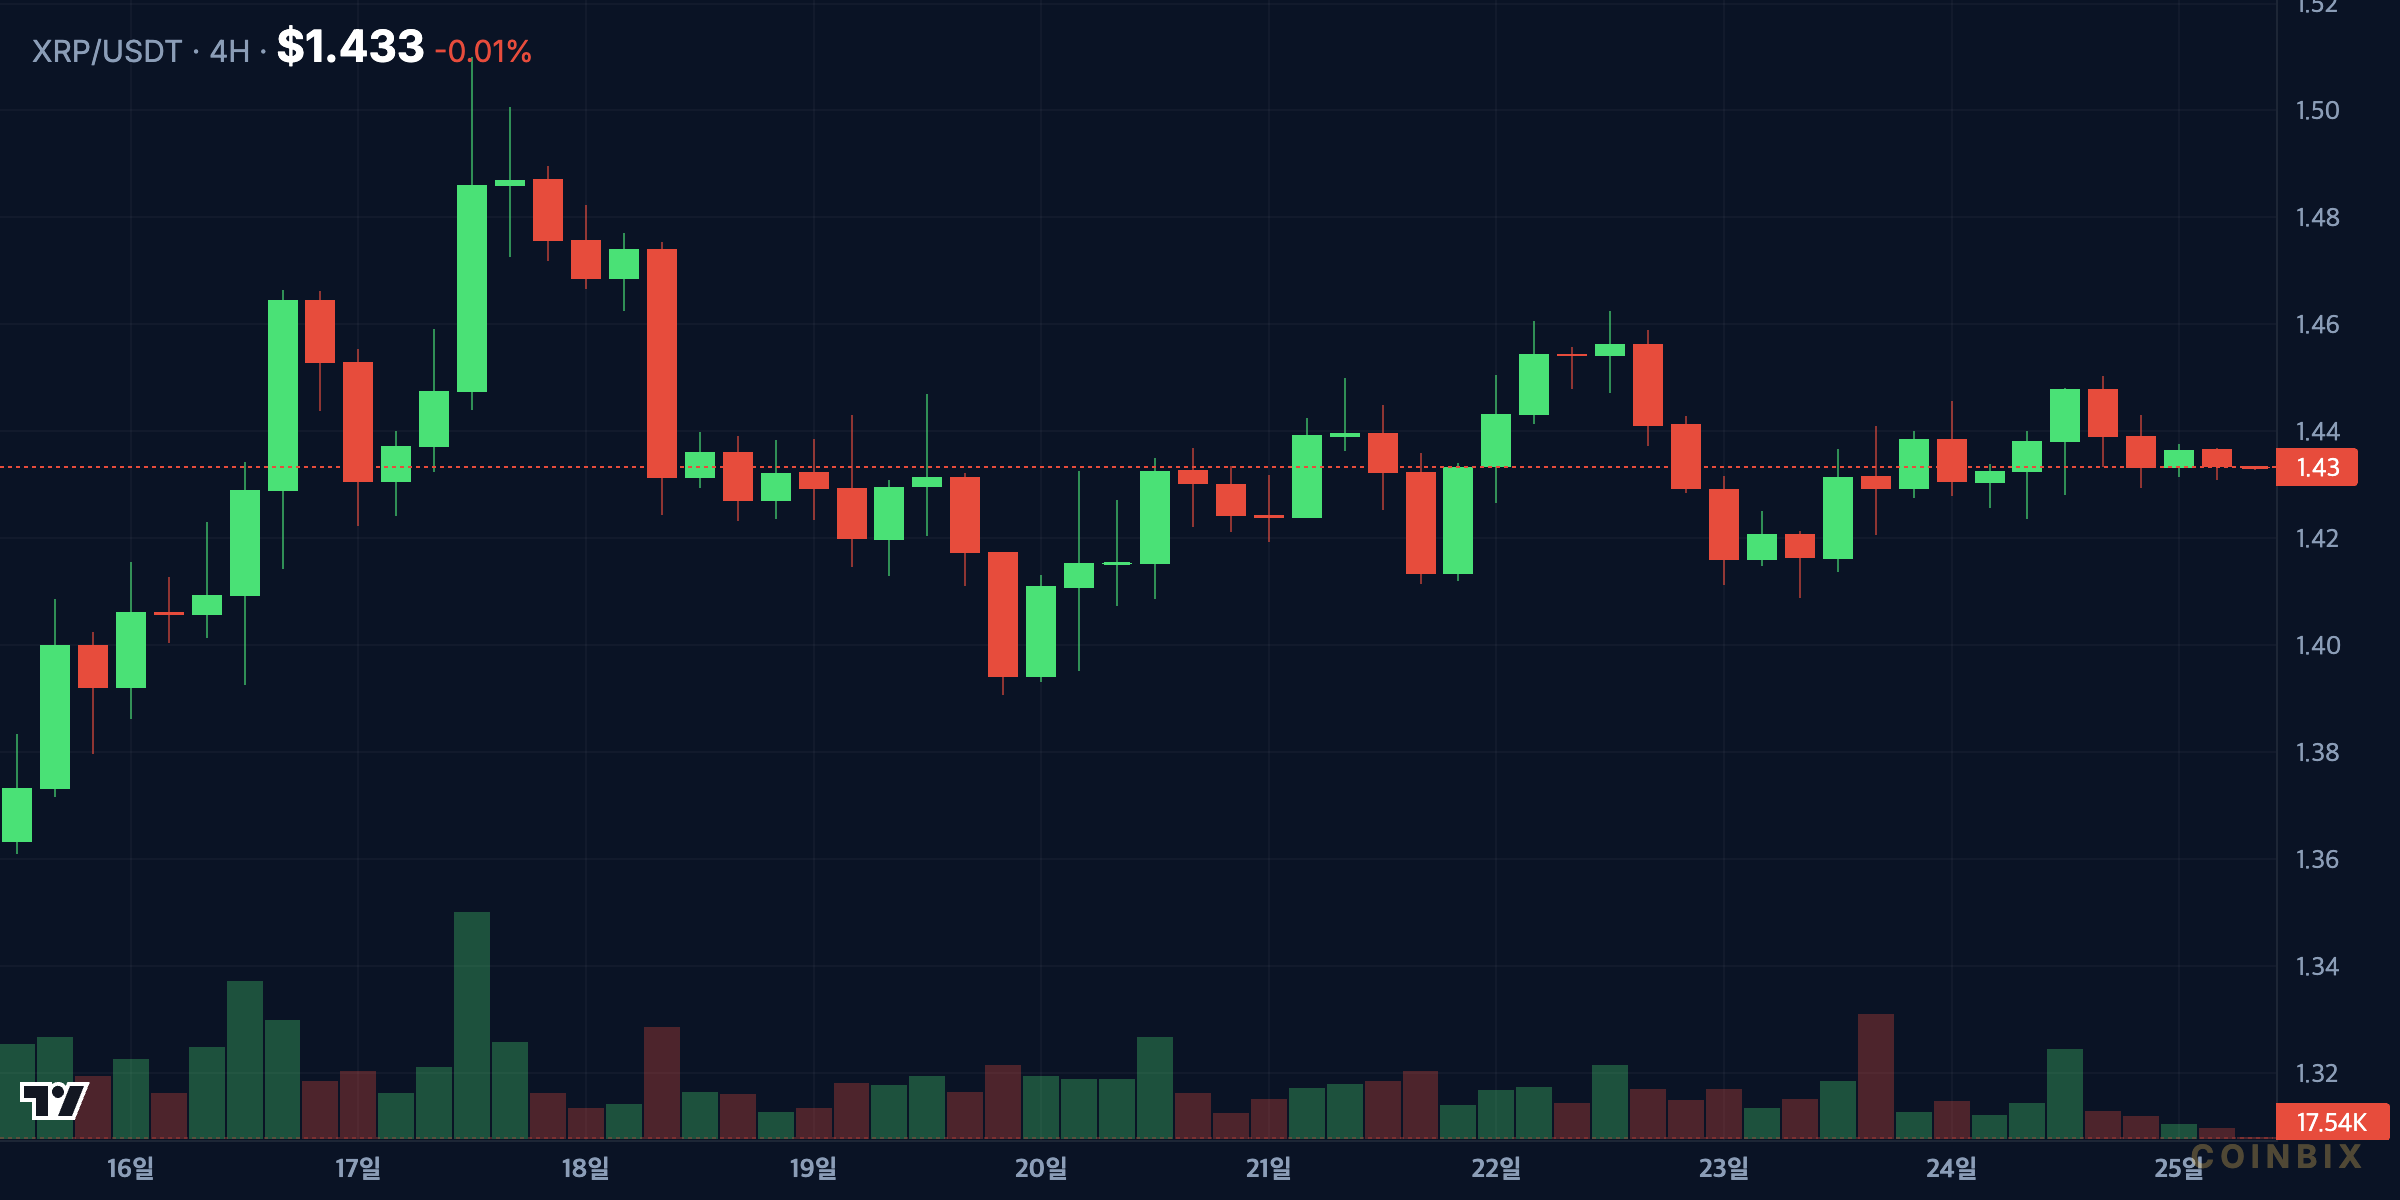
- ■ XRP is compressing inside a triangle near $1.44, with price caught between rising support around $1.38 to $1.40 and overhead resistance near $1.46 to $1.50.
- ▲ A confirmed break above the upper trendline could expose upside zones near $1.60, $1.74, and then the psychological $2.00 region if volume expands.
- ▼ Failure to hold the lower boundary would weaken the setup and put $1.32 and $1.20 back in focus, especially if broader crypto sentiment turns risk-off.
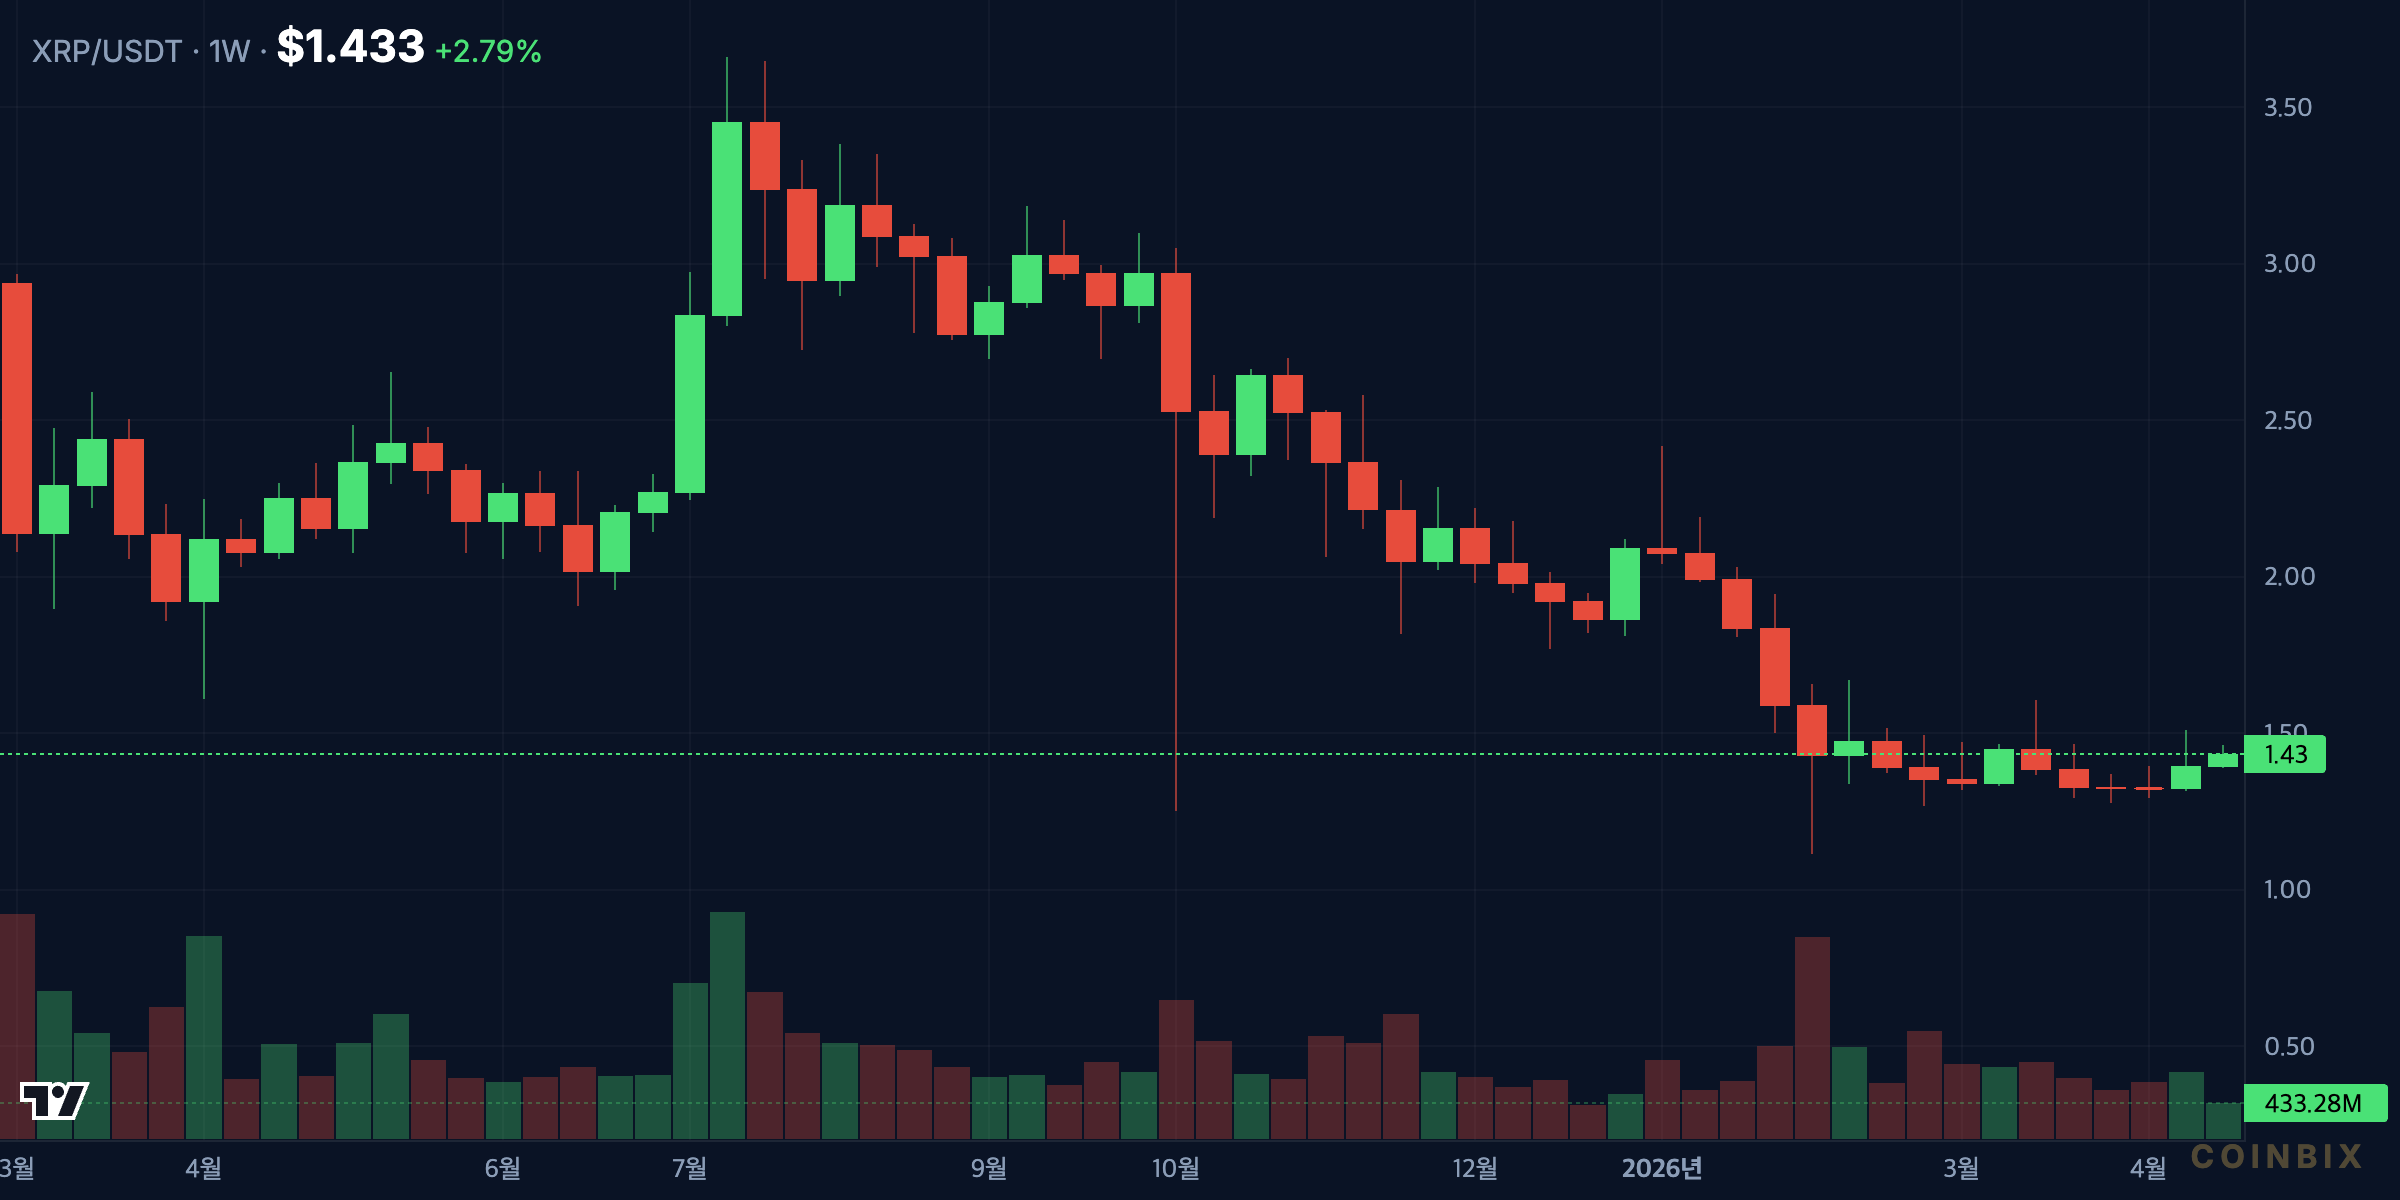
- ■ XRP remains up 8.1% over 30 days, but the token is still far below its $3.65 all-time high, showing the market is trading a recovery structure rather than a full trend reset.
XRP is entering the kind of compression phase that often decides the next meaningful leg of a trend. At roughly $1.43 to $1.44, the token has stopped chasing higher prices and is instead tightening into a triangle formation, a pattern that typically reflects balance between buyers defending higher lows and sellers leaning on a well-defined ceiling. For traders, the setup matters because narrowing range conditions rarely last. Once volatility contracts enough, the next break often produces a directional move that is stronger than the price action that came before it.
That technical backdrop comes at an important time for XRP. The token carries an $88.5 billion market capitalization, ranks fourth among major digital assets, and has posted a modest 0.14% gain over the past 24 hours. Shorter-term momentum has cooled, with XRP down 2.4% over seven days, but the 30-day gain of 8.1% suggests the broader rebound structure remains intact. The question now is not whether XRP has momentum at all, but whether that momentum can survive consolidation and convert into a clean breakout.
Why does the XRP triangle squeeze matter now?
A triangle squeeze matters because it is one of the clearest visual signs that volatility is being stored rather than released. In practical terms, traders are no longer willing to sell XRP aggressively at lower levels, while buyers are still not strong enough to force a sustained move through resistance. That creates a narrowing battle zone. Each touch of support and resistance reduces the available room for price to move sideways, increasing the probability of a decisive resolution.
For XRP, the current structure appears significant because it follows a recovery phase rather than a prolonged collapse. That distinction is important. Triangle patterns that form after a rebound often act as continuation structures, meaning the market is pausing before attempting another advance. However, continuation is never guaranteed. If the lower trendline fails first, what looked like healthy consolidation can quickly become a local distribution pattern.
The immediate trading map is relatively straightforward. On the upside, the first area that needs to break is the short-term cap around $1.46 to $1.50. On the downside, the market needs to hold higher-low support in the $1.38 to $1.40 region. As price moves closer to the apex of the triangle, those lines become even more important because the margin for indecision shrinks.
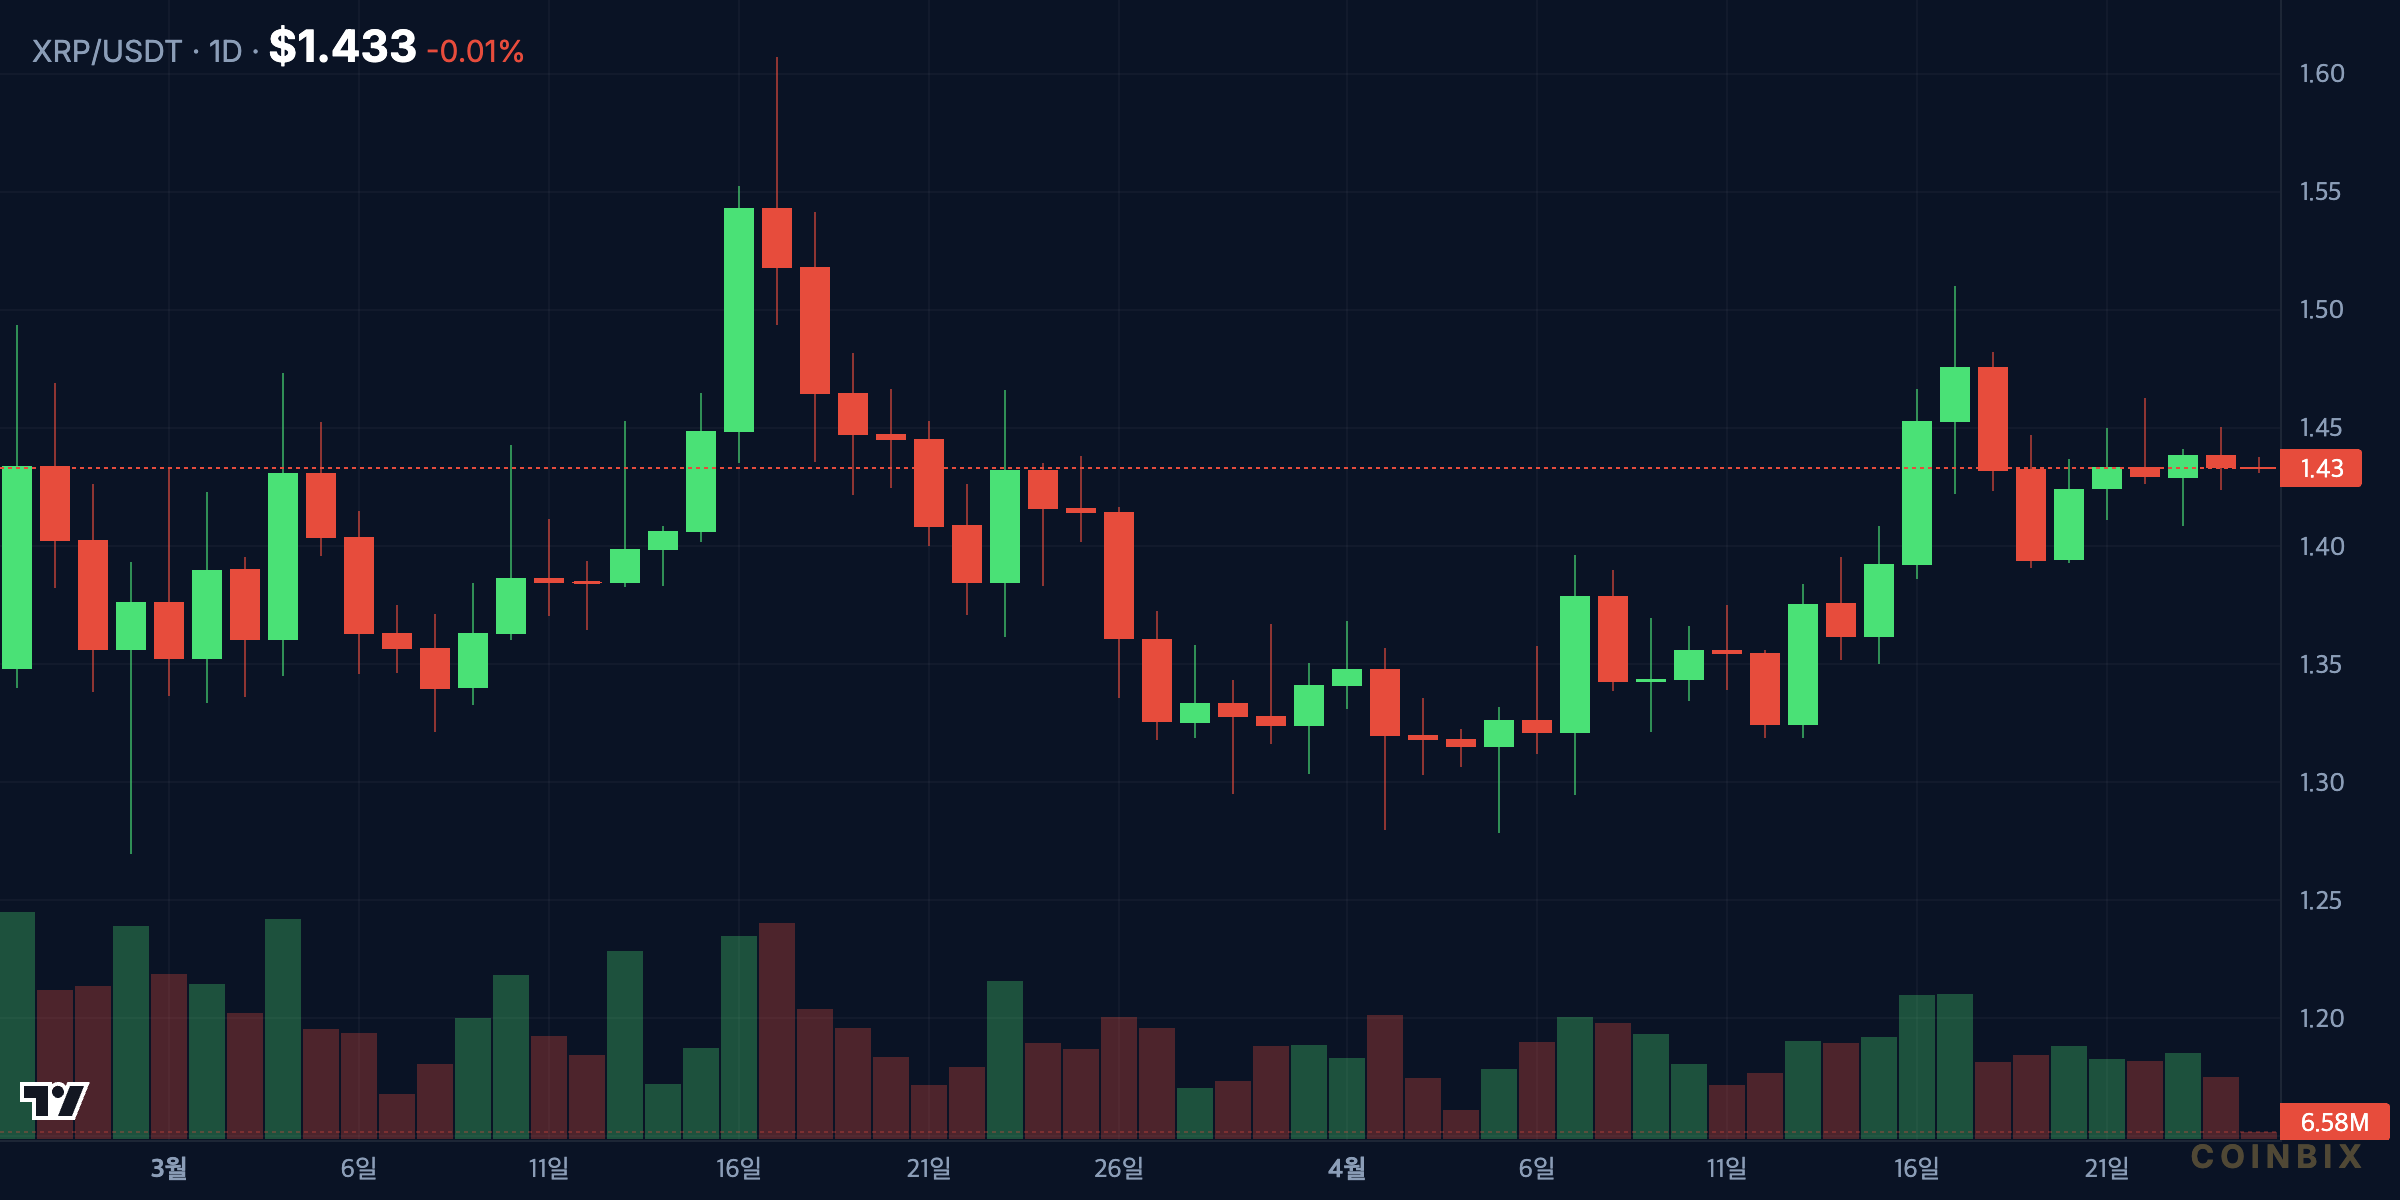
Reading the daily structure: compression above key support
On the daily chart, XRP still looks constructive despite the recent pause. The token has not given back its entire monthly advance, which suggests buyers are still present on dips. That matters because healthy consolidations usually preserve a meaningful portion of the prior move. When price retraces too deeply, the pattern loses its bullish character. XRP has not reached that point yet.
From a structural standpoint, the chart is defined by a sequence of higher lows running into a flatter resistance band. That is consistent with a triangle or squeeze pattern and implies that sellers are being tested repeatedly at similar levels. In technical analysis, repeated pressure on a resistance zone can weaken it over time, especially if pullbacks are shallow. A market that cannot fall much despite several rejection attempts is often a market preparing for another upside test.
Even so, traders should watch how XRP behaves around its short-term moving averages. In squeeze environments, the 20-day and 50-day exponential moving averages often flatten and move closer together as momentum cools. That is not automatically bearish. It simply reflects transition from impulse to consolidation. The more important signal is whether price stays above those averages on closing basis. If XRP keeps reclaiming them after brief dips, the consolidation remains constructive. If it starts closing decisively below both, the market would be signaling waning demand.
Support levels below the current range are also worth tracking in layers rather than as a single line. The first band is near $1.38 to $1.40, where the lower triangle boundary likely intersects with recent swing lows. Beneath that, $1.32 becomes the next relevant area because it would represent a deeper retracement into prior breakout territory. If that level fails, the technical conversation shifts away from squeeze continuation and toward a broader reset.
What does the 4-hour chart say about breakout timing?
The 4-hour chart is usually where squeeze patterns become most actionable, and XRP is no exception. Shorter time frames help traders see whether the market is coiling with declining volatility, whether volume is drying up into the apex, and whether intraday buyers are stepping in sooner on each pullback. Those are the details that often appear just before breakout attempts.
For XRP, the 4-hour structure likely shows price rotating between converging trendlines with increasingly smaller swings. That kind of behavior is typical of late-stage compression. In these conditions, false breaks are common, so candle closes matter more than brief intraday spikes. A move above resistance that immediately fades back into the range is less meaningful than a 4-hour close above the upper boundary accompanied by rising participation.
Volume analysis is particularly important here. A legitimate breakout from a triangle tends to arrive with a noticeable pickup in turnover because stored volatility is finally being released. XRP currently shows about $1.85 billion in volume, which is substantial in absolute terms, but the more relevant question is whether activity expands relative to the recent baseline. If price breaks higher while volume stays muted, the move may struggle to sustain itself. If both price and volume rise together, the odds improve that the breakout can travel toward the next resistance band.
Traders should also watch the character of pullbacks during the 4-hour cycle. A bullish setup usually produces pullbacks that are brief, orderly, and bought before reaching the prior swing low. If XRP starts printing impulsive red candles through support, the market is signaling that the balance of power is changing before the formal breakdown occurs.
Volume, momentum, and the case for a directional move
Triangle squeezes are not just about lines on a chart. They are also about momentum transfer. A narrowing pattern often reflects decreasing realized volatility, but that compression can precede a jump in directional momentum once one side gives way. In XRP’s case, the recent 7-day decline of 2.4% suggests momentum has cooled, yet the stronger 30-day gain shows the bigger trend has not been erased. That tension is exactly what creates a meaningful setup.
Momentum indicators in these phases often hover near neutral. That can frustrate traders looking for early confirmation, but it is also normal. Oscillators such as RSI tend to drift toward the middle of their range as price compresses. What matters is how they respond at the moment of escape. If XRP breaks resistance and momentum indicators re-expand into bullish territory without showing immediate divergence, that would strengthen the continuation case. If price pushes up but momentum fails to confirm, the market may be warning of exhaustion rather than expansion.
Another useful lens is relative strength versus the broader crypto market. XRP does not trade in isolation. If bitcoin and major large-cap tokens are stable or trending higher, XRP has a better chance of converting a local triangle into a sustained breakout. If the broader market is selling off, even a technically sound XRP setup can fail. That macro filter matters because altcoin breakouts are often regime-dependent rather than purely pattern-dependent.
 Bybit 20% Fee Discount
Free Coinbix Premium Channel
Breakout targets and downside risk zones
When traders project targets from a triangle, they typically use the height of the widest part of the pattern and apply that distance from the breakout point. While exact levels depend on where analysts draw the boundaries, the current XRP structure points to several practical checkpoints. The first is the upper resistance band at $1.46 to $1.50. Clearing that region on convincing volume would shift focus to $1.60, where short-term profit-taking could emerge.
Above $1.60, the next relevant zone is near $1.74, which would represent a more meaningful extension of the current advance and confirm that the market has moved beyond a minor range break. If momentum remains strong, traders would likely start discussing the psychological $2.00 threshold. That level matters not only because it is round-number resistance, but also because it would signal that XRP has made significant progress from its current consolidation base.
On the bearish side, the lower boundary near $1.38 to $1.40 is the first line that must hold. A breakdown through that region would suggest that buyers are no longer willing to defend increasingly higher lows. In that case, $1.32 becomes the next technical checkpoint, followed by $1.20 if the move accelerates. A drop into those areas would not erase XRP’s longer-term relevance, but it would invalidate the near-term bullish squeeze thesis and likely delay any attempt to challenge higher resistance bands.
Risk management is especially important because triangle patterns frequently produce fakeouts before the real move begins. Traders who chase the first spike without waiting for confirmation can get trapped. That is why closes, volume confirmation, and reaction after breakout are more reliable than isolated price wicks.
How does this compare with previous XRP cycles?
XRP has a long history of sharp impulse moves followed by lengthy periods of compression. That behavior reflects both its speculative trading profile and the tendency of market participants to crowd around key narrative moments. In previous cycles, strong XRP rallies often paused in consolidation structures before the next trend leg either accelerated or failed. The current setup fits that broader behavioral pattern.
What makes this cycle different is scale. XRP is trading at $1.43, well below its all-time high of $3.65, which means the market is still in recovery territory rather than price discovery. In prior full bullish phases, breakouts had the advantage of broad market participation and stronger speculative inflows. Today’s setup is more selective. That means technical levels matter even more because the market may require cleaner confirmation before assigning higher valuations.
There is also a psychological component. Tokens trading far below their all-time highs often attract two competing groups: long-term holders waiting for a larger recovery and shorter-term traders willing to sell into resistance. That can create persistent overhead supply. For XRP, that dynamic helps explain why a breakout through the current ceiling would matter. It would show that buyers are absorbing local sell pressure rather than simply bidding within a contained range.
Weekly context: why the bigger picture still matters
The weekly chart helps frame whether the current triangle is just noise or part of a broader continuation structure. From that perspective, XRP’s 8.1% gain over 30 days looks more meaningful. It suggests the token has been rebuilding after prior weakness instead of remaining trapped in a one-directional downtrend. Weekly context also reduces the temptation to overreact to every intraday move, which is especially useful when price is compressing.
If XRP can hold above the most recent weekly support zone while continuing to print higher lows, the market retains a constructive medium-term posture. A bullish breakout on the daily and 4-hour chart would then align with the weekly structure, giving the move stronger technical credibility. Alignment across time frames often matters because high-conviction breakouts tend to show similar direction on short, medium, and long horizons.
However, if the weekly chart starts rejecting higher prices and closes back below support, the interpretation changes quickly. In that case, the triangle on lower time frames could be acting as a pause before another leg lower rather than a launchpad. This is why multi-time-frame analysis is essential. A breakout that fights the weekly trend is usually less reliable than one that moves with it.
Bull and bear scenarios from here
The bullish scenario is relatively clear. XRP continues respecting the lower trendline, volatility contracts a bit further, and then buyers force a break above $1.46 to $1.50 on expanding volume. That would likely trigger momentum buying, push the token toward $1.60, and open the path to $1.74 and potentially $2.00 if the broader crypto market remains stable. In this scenario, the triangle functions as a continuation pattern within a still-healthy recovery trend.
The bear scenario is just as important. XRP fails to attract fresh demand near the apex, support gives way, and the token closes below $1.38 to $1.40. That would weaken the higher-low sequence that underpins the current pattern and shift attention to $1.32 or lower. If the breakdown is accompanied by rising sell volume, it would suggest that the market is not merely consolidating but redistributing supply before another pullback.
There is also a neutral scenario that traders often overlook. XRP could remain trapped in range longer than expected, producing several false starts without true follow-through. That would keep volatility compressed and frustrate both breakout buyers and breakdown sellers. In that environment, patience becomes a strategy in itself.
The bottom line is that XRP is near an inflection point, but confirmation still matters more than anticipation. The pattern is promising, the broader monthly trend is constructive, and the technical map is clear. Yet the token still needs to prove that this squeeze is a springboard rather than a stall. Until that happens, support at $1.38 to $1.40 and resistance at $1.46 to $1.50 remain the market’s most important decision levels.
Bybit 20% Fee Discount
Free Coinbix Premium Channel
FAQ
What is the XRP triangle squeeze?
The XRP triangle squeeze is a chart pattern where price moves between converging support and resistance lines, showing lower volatility and a tightening range before a likely breakout or breakdown.
What level confirms an XRP breakout?
A confirmed bullish breakout would likely require XRP to close above the upper resistance zone near $1.46 to $1.50 with stronger-than-recent volume, rather than just briefly spike above it.
What happens if XRP loses support?
If XRP falls below the lower support area around $1.38 to $1.40, the bullish squeeze setup weakens and the next downside levels to watch would be around $1.32 and then $1.20.
Why does volume matter in this setup?
Volume helps distinguish real breakouts from false moves. A triangle break with expanding participation is generally more reliable than one that happens on weak turnover.
Is XRP still in a recovery trend?
XRP appears to be in a recovery structure rather than a full trend reset. The token is up 8.1% over 30 days, but it remains well below its $3.65 all-time high, so the larger recovery is still incomplete.
Affiliate Disclosure: This page contains affiliate links. Coinbix may earn a commission at no extra cost to you.
Disclaimer: This article is for informational purposes only and does not constitute financial advice. Cryptocurrency investments carry significant risk. Always conduct your own research before making investment decisions.