- ▼ XRP moved from $1.33 to $1.35 but failed to sustain momentum above the $1.34 breakout level
- ▼ The breakout occurred on strong volume but showed a notable lack of follow-through buying
- ▼ XRP ETF inflows totaled only $3.32M, suggesting limited institutional participation
- ▼ No clear fundamental catalyst emerged to support sustained price appreciation
- ▼ Critical resistance remains at $1.36-$1.40, while support holds at $1.31-$1.32
- ▼ A failed breakout below $1.32-$1.31 could trigger downside toward $1.28
- ▼ Price action continues within a broader downtrend structure
Introduction
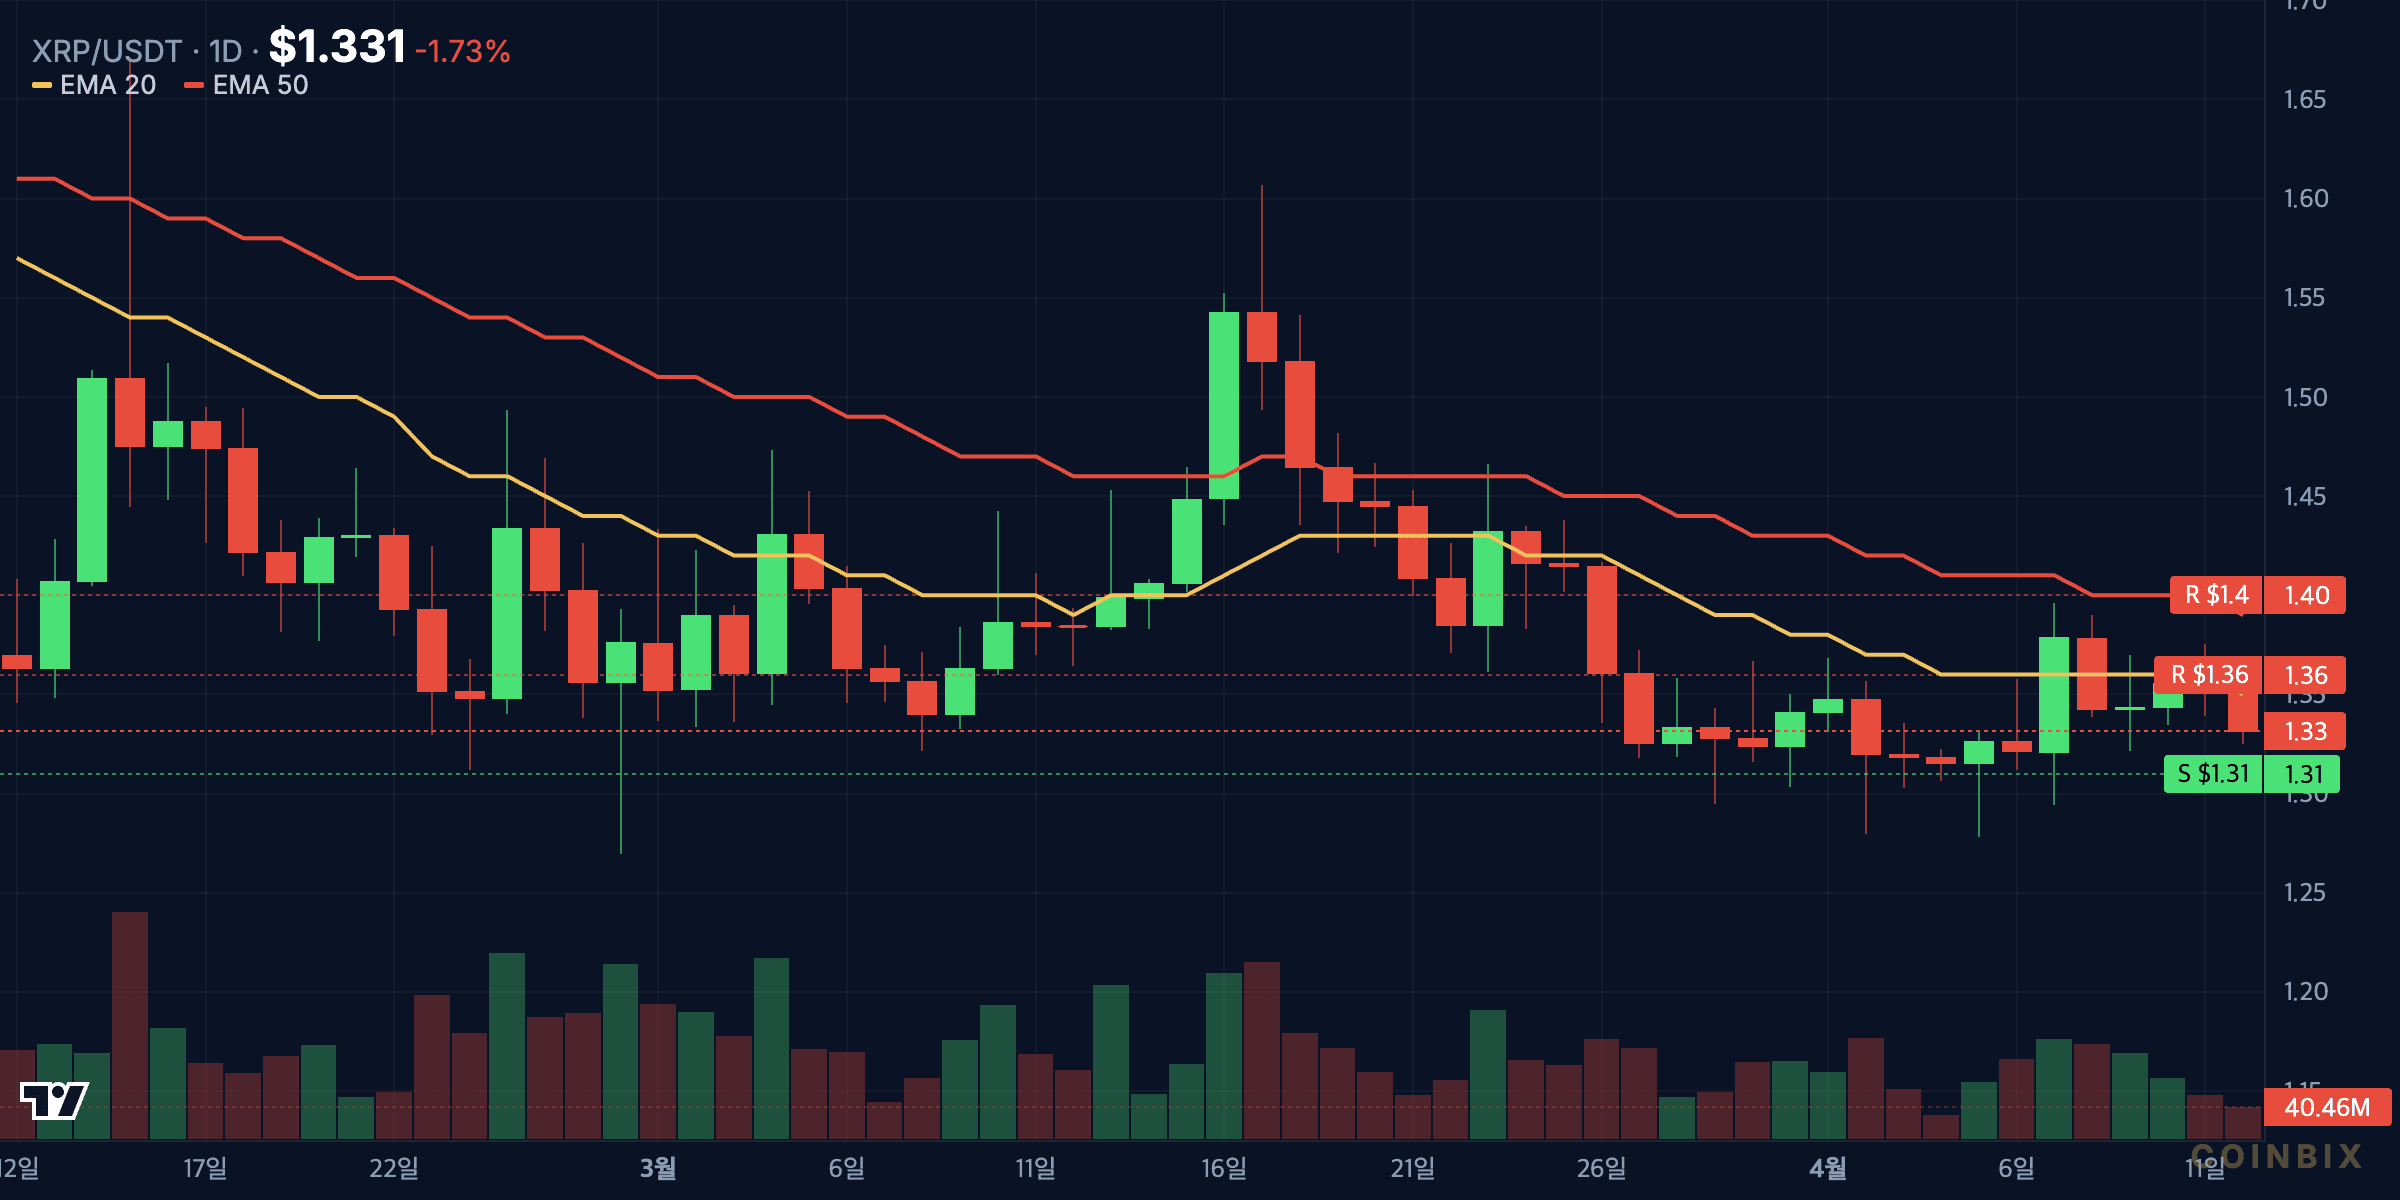
XRP experienced a brief technical breakout on April 10, 2026, with prices climbing from $1.33 to $1.35 before encountering significant resistance. While the move above $1.34 initially appeared promising on strong trading volume, the subsequent lack of follow-through has raised questions about the sustainability of this price action. Market data reveals modest ETF inflows of just $3.32M and an absence of clear fundamental catalysts, leaving analysts to weigh the possibility of a failed breakout against the potential for renewed upward momentum.
This analysis examines the technical structure of XRP’s recent price movement, the institutional flow dynamics through ETF products, and the key levels that will determine whether bulls can reclaim control or bears push prices back toward multi-week lows.
Technical Breakdown: What Happened at $1.34?
The Breakout Structure
XRP’s price action on April 10 demonstrated a classic technical breakout pattern. The asset moved decisively above the $1.34 resistance level, reaching an intraday high of $1.35 before encountering selling pressure. The initial surge was accompanied by above-average trading volume, typically a bullish signal confirming institutional participation.
However, the critical failure emerged in the hours following the breakout. Rather than consolidating above $1.34 and building a foundation for further gains, XRP retreated below the breakout level. This lack of follow-through suggests that the move may have been driven by short-term speculative flows rather than sustained institutional demand.
Volume Analysis
The strong volume observed during the initial breakout contrasts sharply with the declining participation during the subsequent pullback. This divergence often indicates distribution, where larger holders use the breakout to reduce exposure rather than accumulate additional positions. Volume confirmation is essential for validating breakouts, and the absence of sustained buying interest raises concerns about the pattern’s reliability.
Critical Price Levels to Watch
Resistance Zone: $1.36-$1.40
The $1.36-$1.40 range represents a confluence of technical resistance, including previous support-turned-resistance levels and the 20-day moving average. A decisive close above $1.40 would be required to invalidate the broader downtrend and signal a potential trend reversal. Until this occurs, the path of least resistance remains lower.
Support Zone: $1.31-$1.32
Immediate support exists at $1.31-$1.32, a zone that has previously acted as a floor for XRP price action. A failure to hold this level would confirm the breakout as a bull trap, potentially accelerating selling pressure toward the next significant support at $1.28.
Downside Target: $1.28
Should XRP break below $1.31, the measured move from the failed breakout pattern suggests a retest of the $1.28 level, representing approximately 4.5% downside from current prices. This target aligns with the lower boundary of the descending channel that has contained price action since late March 2026.
ETF Flows: Institutional Sentiment Remains Cautious
The $3.32M Inflow Context
Despite the technical breakout, XRP-linked ETF products saw only modest inflows of $3.32M during the session. This figure stands in stark contrast to the hundreds of millions in weekly flows observed during strong bullish phases for competing assets like Bitcoin and Ethereum. The tepid institutional participation suggests that traditional market participants remain unconvinced by the breakout’s validity.
ETF flows serve as a proxy for institutional sentiment, and the current data indicates a wait-and-see approach. Without meaningful capital allocation from regulated investment vehicles, breakouts in underlying assets often lack the sustained buying pressure necessary for trend continuation.
Implications for Price Discovery
The disconnect between spot market volume and ETF inflows creates a challenging environment for price discovery. While retail and speculative traders may drive short-term volatility, institutional flows typically provide the foundation for sustained trends. The current divergence suggests that any rally remains vulnerable to reversal until ETF participation meaningfully increases.
Why Did the Breakout Fail?
Absence of Fundamental Catalysts
Technical breakouts require fundamental narratives to sustain momentum. In the case of XRP’s April 10 move, no significant catalyst emerged to justify a sustained repricing. Regulatory developments, partnership announcements, and network upgrades all remained absent from the news flow, leaving traders without a compelling reason to maintain long exposure above resistance.
Broader Market Context
XRP’s price action must be viewed within the context of broader cryptocurrency market conditions. The asset continues to trade within a well-defined downtrend channel, making lower highs and lower lows since mid-March 2026. Breakouts within downtrends carry inherently higher failure rates, as they must overcome not only technical resistance but also the prevailing market structure.
Risk Management Considerations
For active traders, failed breakouts represent significant risk events. The concentration of stop-loss orders above resistance levels often attracts algorithmic selling pressure once those levels fail to hold. This dynamic can accelerate price reversals, turning what appeared to be a bullish setup into a trap for late entrants.
What Happens Next?
Scenario 1: Failed Breakout Confirmed
If XRP closes below $1.31-$1.32, the failed breakout scenario will be confirmed. In this case, traders should expect a rapid move toward $1.28, with the potential for a deeper correction if broader market conditions deteriorate. The stop-loss cascade from trapped long positions could exacerbate selling pressure.
Scenario 2: Range Consolidation
A more constructive outcome would see XRP consolidating between $1.31 and $1.36, building a base for a more sustainable breakout attempt. This scenario would require declining selling pressure and a gradual accumulation pattern on the volume profile.
Scenario 3: Bullish Reversal
While less probable given current conditions, a decisive close above $1.40 would invalidate the failed breakout thesis and suggest that institutional accumulation is occurring off-exchange. Traders should watch for volume expansion on any move above this critical threshold.
Conclusion
XRP’s brief excursion above $1.34 serves as a reminder that not all breakouts lead to sustained trends. The combination of modest ETF inflows, absent fundamental catalysts, and failure to hold key resistance levels paints a cautious picture for near-term price action. While the technical structure leaves room for either direction, the preponderance of evidence suggests that the path of least resistance remains lower until proven otherwise.
Traders and investors should monitor the $1.31-$1.32 support zone closely, as a break below this level would confirm the failed breakout and open the door to a retest of $1.28. Conversely, only a decisive close above $1.40 would shift the risk-reward calculus in favor of the bulls.
FAQ
What caused XRP’s price breakout above $1.34?
XRP’s move above $1.34 appeared technically driven, occurring on strong volume but without a clear fundamental catalyst. The breakout lacked institutional confirmation, as evidenced by modest ETF inflows of only $3.32M.
Is XRP’s breakout above $1.34 sustainable?
The sustainability of the breakout remains questionable due to the lack of follow-through buying and the failure to hold above the breakout level. Critical support at $1.31-$1.32 must hold to prevent a reversal toward $1.28.
What are the key resistance levels for XRP?
Immediate resistance exists at $1.36-$1.40, with the $1.40 level representing the threshold required to invalidate the current downtrend structure and signal a potential trend reversal.
How much did XRP ETFs receive in inflows during the breakout?
XRP-linked ETF products saw only $3.32M in inflows during the breakout session, a relatively modest figure that suggests limited institutional participation in the price move.
What happens if XRP fails to hold the $1.31-$1.32 support level?
A failure to hold $1.31-$1.32 would confirm the breakout as a bull trap and likely trigger a move toward $1.28, representing approximately 4.5% downside from current levels.
Is XRP in a downtrend?
Yes, XRP continues to trade within a broader downtrend channel characterized by lower highs and lower lows since late March 2026. Breakouts within such structures carry inherently higher failure rates.
By Leon | Crypto Market Analyst at Coinbix
Affiliate Disclosure: This page contains affiliate links. Coinbix may earn a commission at no extra cost to you.
Affiliate Disclosure: This page contains affiliate links. Coinbix may earn a commission at no extra cost to you.
Disclaimer: This article is for informational purposes only and does not constitute financial advice. Cryptocurrency investments carry significant risk. Always conduct your own research before making investment decisions.