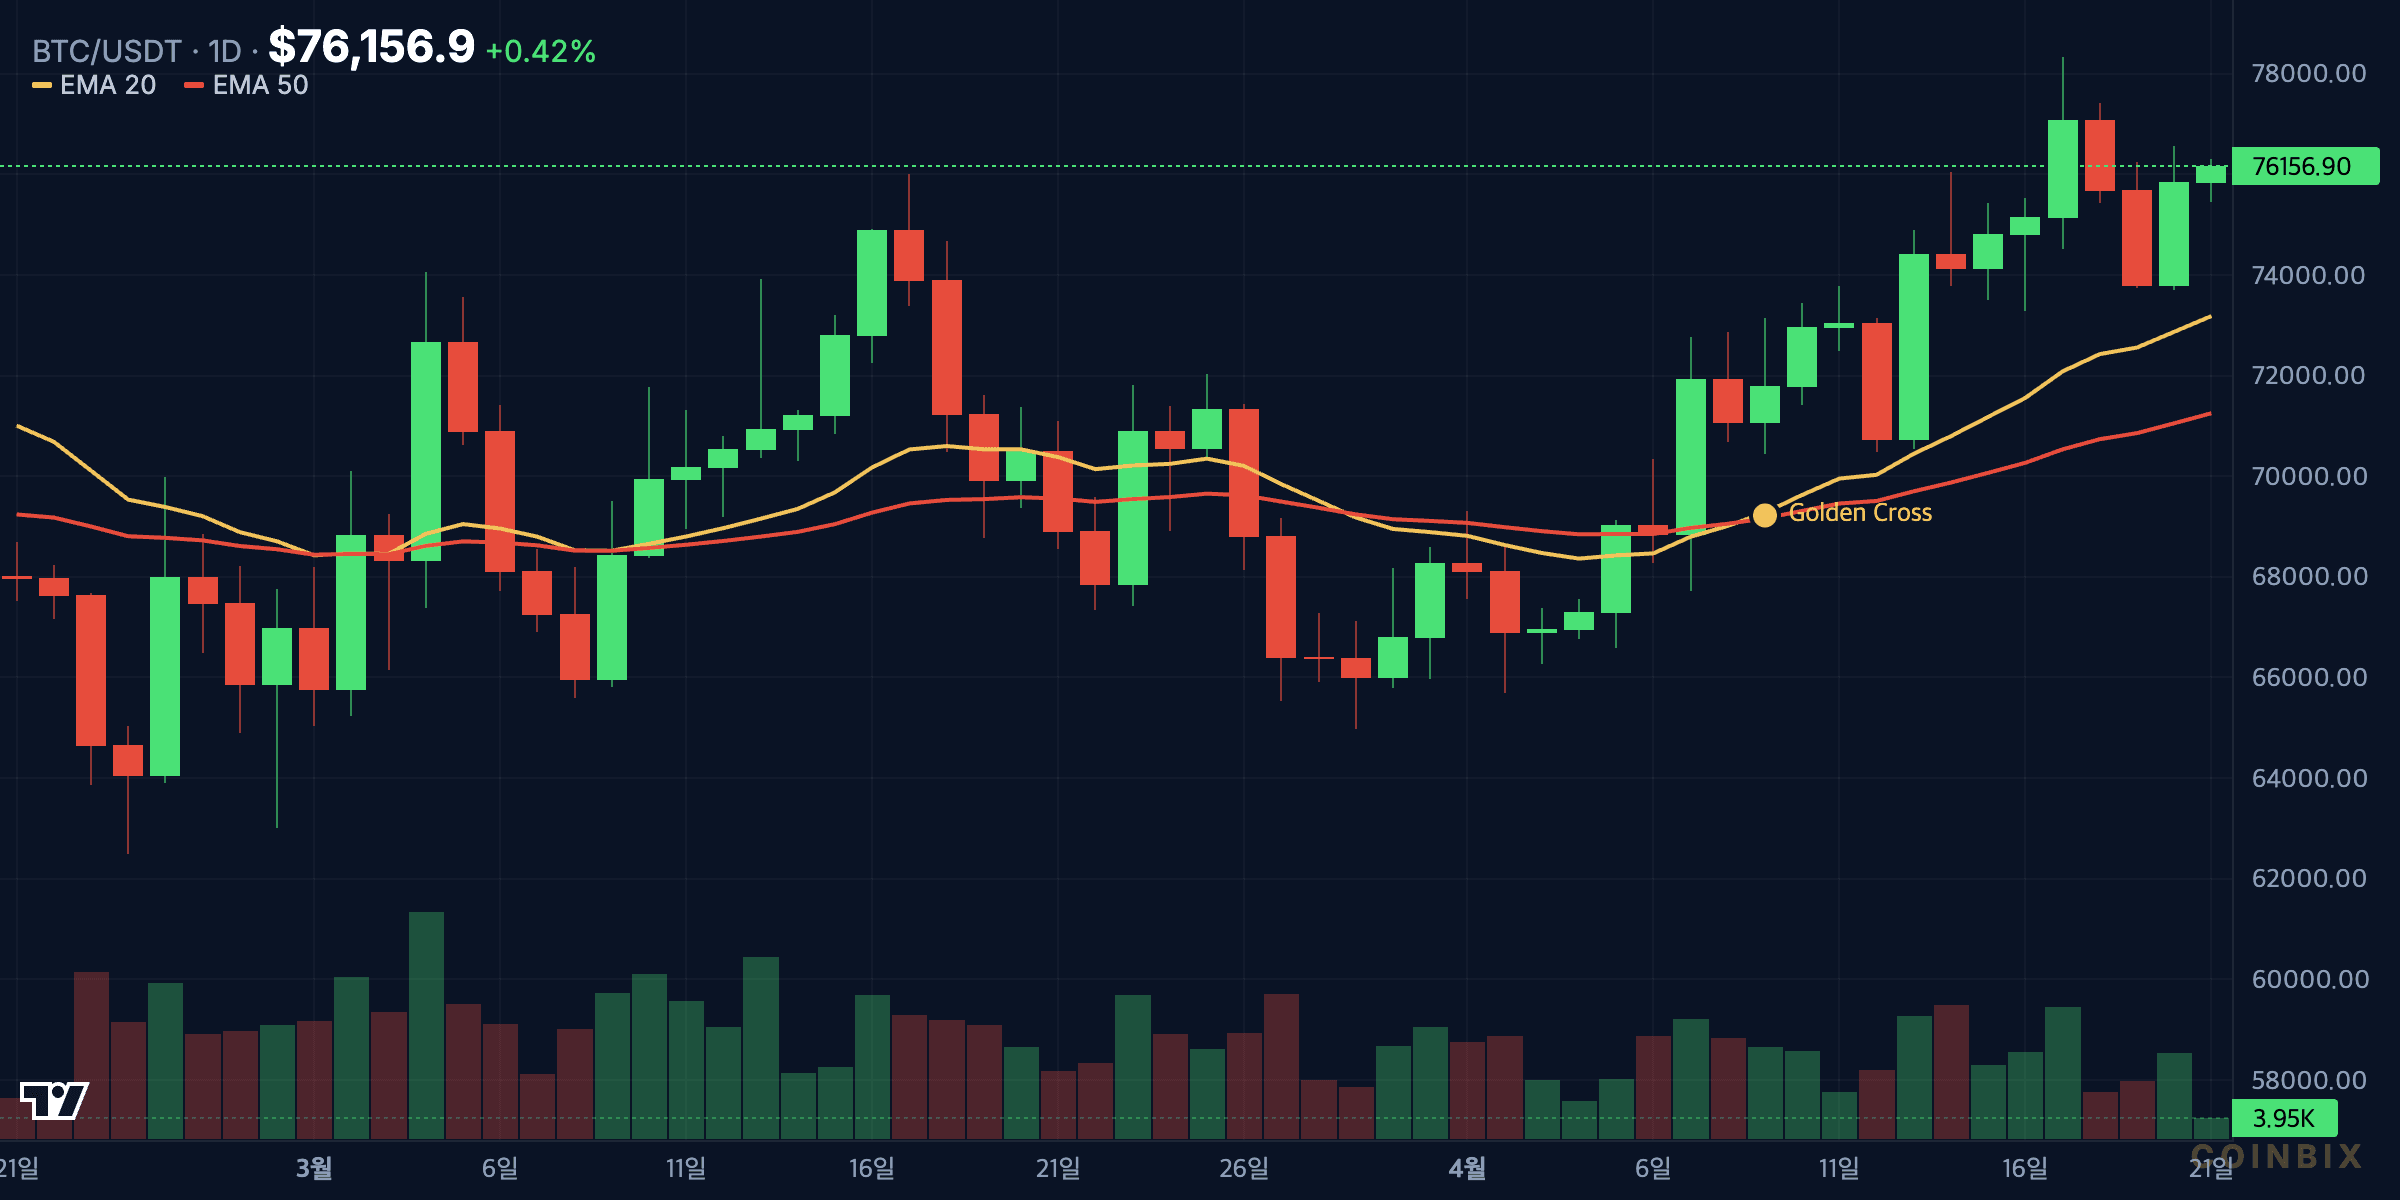
- ▲ Bitcoin is still holding above its 20-day EMA near $72,832, keeping the path open toward the $76,000 to $78,333 resistance band and potentially $84,000 if that ceiling breaks.
- ■ Ether remains trapped between $1,916 and $2,415, but repeated defense of the 20-day EMA around $2,252 suggests buyers are still active on dips.
- ■ Solana is the weakest of the three near-term setups because it slipped back under its moving averages, leaving $76 as the key downside test unless bulls reclaim $90 quickly.
- ▲ Broader risk appetite remains constructive as US spot Bitcoin ETFs pulled in $996 million for the week, while Strategy disclosed another 34,164 BTC purchase in an 8-K filing with the SEC.
Bitcoin, Ether, and Solana all enter the new week with the same core question, can risk assets extend a relief rally while macro uncertainty stays elevated? Cointelegraph’s April 20 market read argues that buyers are still stepping in on weakness, but the technical picture is far from clean. That makes the next move less about broad optimism and more about whether each asset can hold its nearest support while reclaiming overhead resistance with conviction.
The wider backdrop is mixed rather than outright bullish. According to SoSoValue data cited by Cointelegraph, US spot Bitcoin ETFs drew $996 million in inflows last week, the strongest weekly result since early January. At the same time, geopolitical tension around the US-Iran ceasefire remains a live macro risk, meaning a fragile improvement in sentiment could still reverse if headline pressure returns. For traders, that kind of environment usually rewards level-to-level discipline over aggressive breakout chasing.
Bitcoin still leads, but can it clear overhead supply?
Bitcoin remains the strongest chart in this trio because buyers defended the 20-day exponential moving average near $72,832. In trend analysis, a successful test of the 20-day EMA after a breakout attempt often signals that short-term participants are still willing to accumulate rather than wait for a deeper reset. That matters because Bitcoin is not reacting like an exhausted market yet. Instead, it is acting like a market pausing below resistance.
The immediate challenge is the overhead resistance zone between $76,000 and $78,333. Cointelegraph identifies that band as the first serious supply area, and the logic is straightforward. Sellers who missed the previous downturn often use these recovery levels to reduce exposure, while shorter-term traders take profit into a known ceiling. If Bitcoin gets rejected there and loses both its short-term moving averages, the setup would start to resemble a failed breakout. In that case, the market could slip back into a broader consolidation phase rather than resume a directional rally.
That said, the bullish case is still stronger as long as price continues to hold above the 20-day EMA and forms higher lows beneath resistance. A confirmed close above $78,333 would suggest the market has absorbed nearby supply. Cointelegraph then maps $84,000 as the next upside objective, followed by a pattern target near $92,000. Those levels are ambitious, but they are not arbitrary. They reflect what typically happens when a market breaks through a congestion ceiling after proving that buyers are comfortable absorbing profit-taking pressure.
Momentum confirmation would ideally come from two places. First, the daily candle should close above resistance instead of merely wicking into it. Second, volume should expand as the breakout develops. Without those signals, Bitcoin risks printing another local rejection and extending the range. For now, the base case remains constructive, but it is conditional, not guaranteed.
What makes Ethereum more fragile than Bitcoin right now?
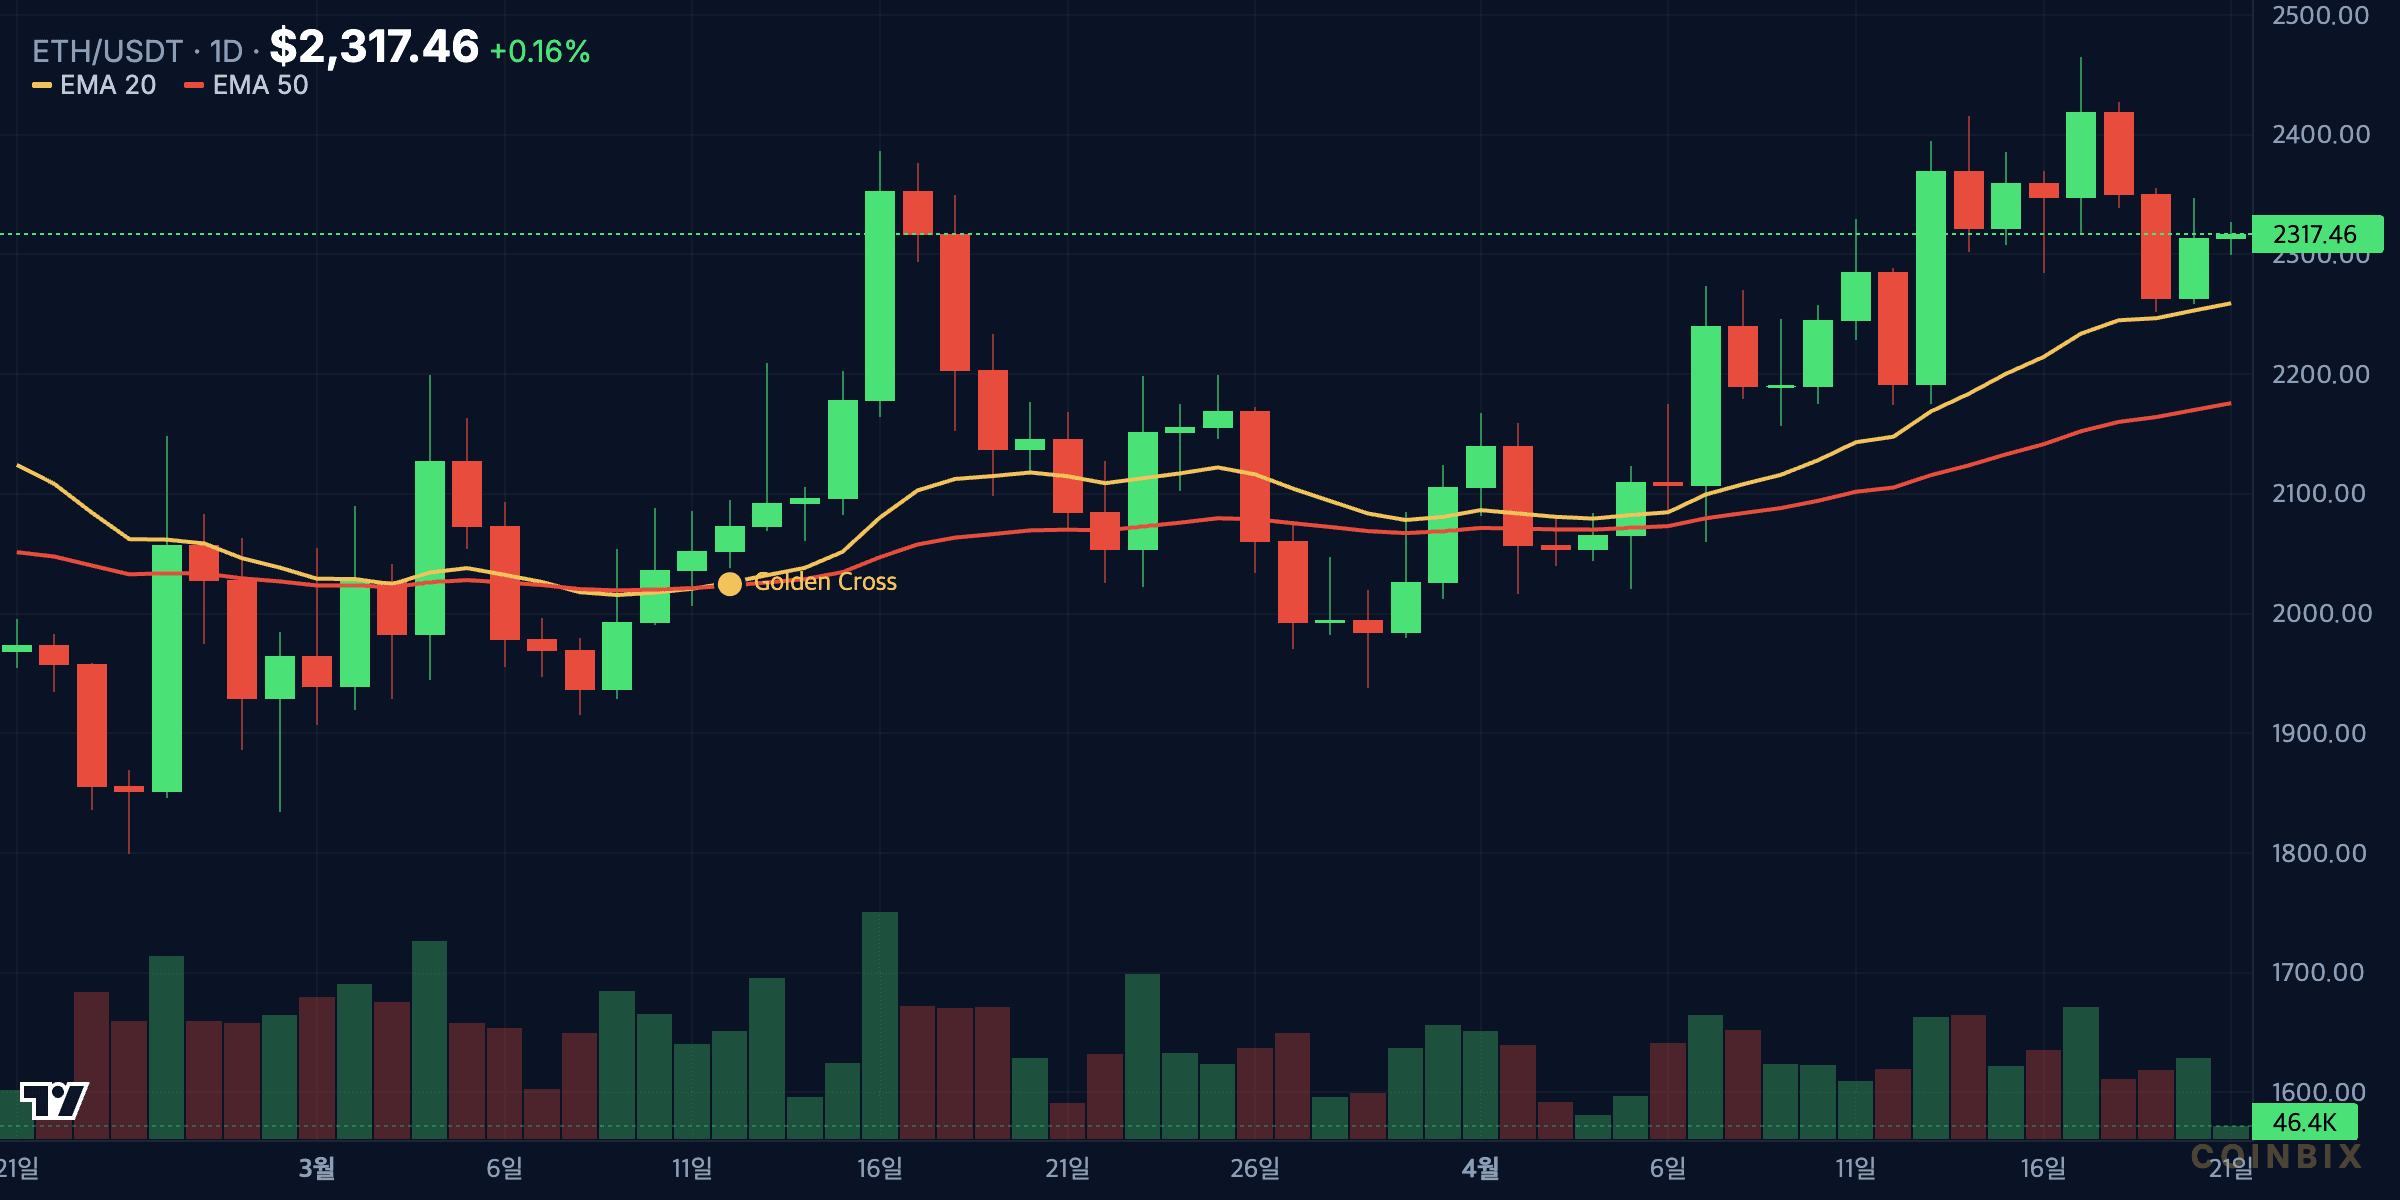
Ether is in a less decisive position. The market attempted to move through $2,415, but bears defended that level and pushed price back to the 20-day EMA near $2,252. That leaves ETH stuck between a confirmed resistance ceiling and a support band that still has to prove itself. In practical terms, Ethereum is not breaking down, but it also is not showing the same leadership quality as Bitcoin.
The daily setup is important because ETH has already spent meaningful time inside the $1,916 to $2,415 range. Range conditions tend to create noisy price action, especially when moving averages flatten and directional momentum weakens. Traders often get chopped in these environments because every upside attempt looks like an early breakout and every downside move looks like the start of a larger failure. The higher-probability trade usually appears only after the market leaves the range on a daily closing basis.
For bulls, the job is clear. They need to defend the 20-day EMA and then force a clean close above $2,415. If that happens, Cointelegraph sees a move toward $2,800. Technically, that target makes sense because a breakout from a multi-week range often leads to a fast repricing as sidelined buyers re-enter and short sellers cover. Ethereum would also benefit if Bitcoin clears its own overhead resistance, since ETH rarely sustains an independent breakout when BTC is stalled.
If ETH loses the moving averages and fails to recover them quickly, the pair likely stays trapped inside the broader range and rotates back toward lower support. That would confirm that Ethereum still lacks enough demand to reclaim leadership. For now, ETH remains a confirmation trade, with $2,415 as the level that has to break before momentum meaningfully improves.
Solana faces the toughest test after slipping below its averages
 Bybit 20% Fee Discount
Free Coinbix Premium Channel
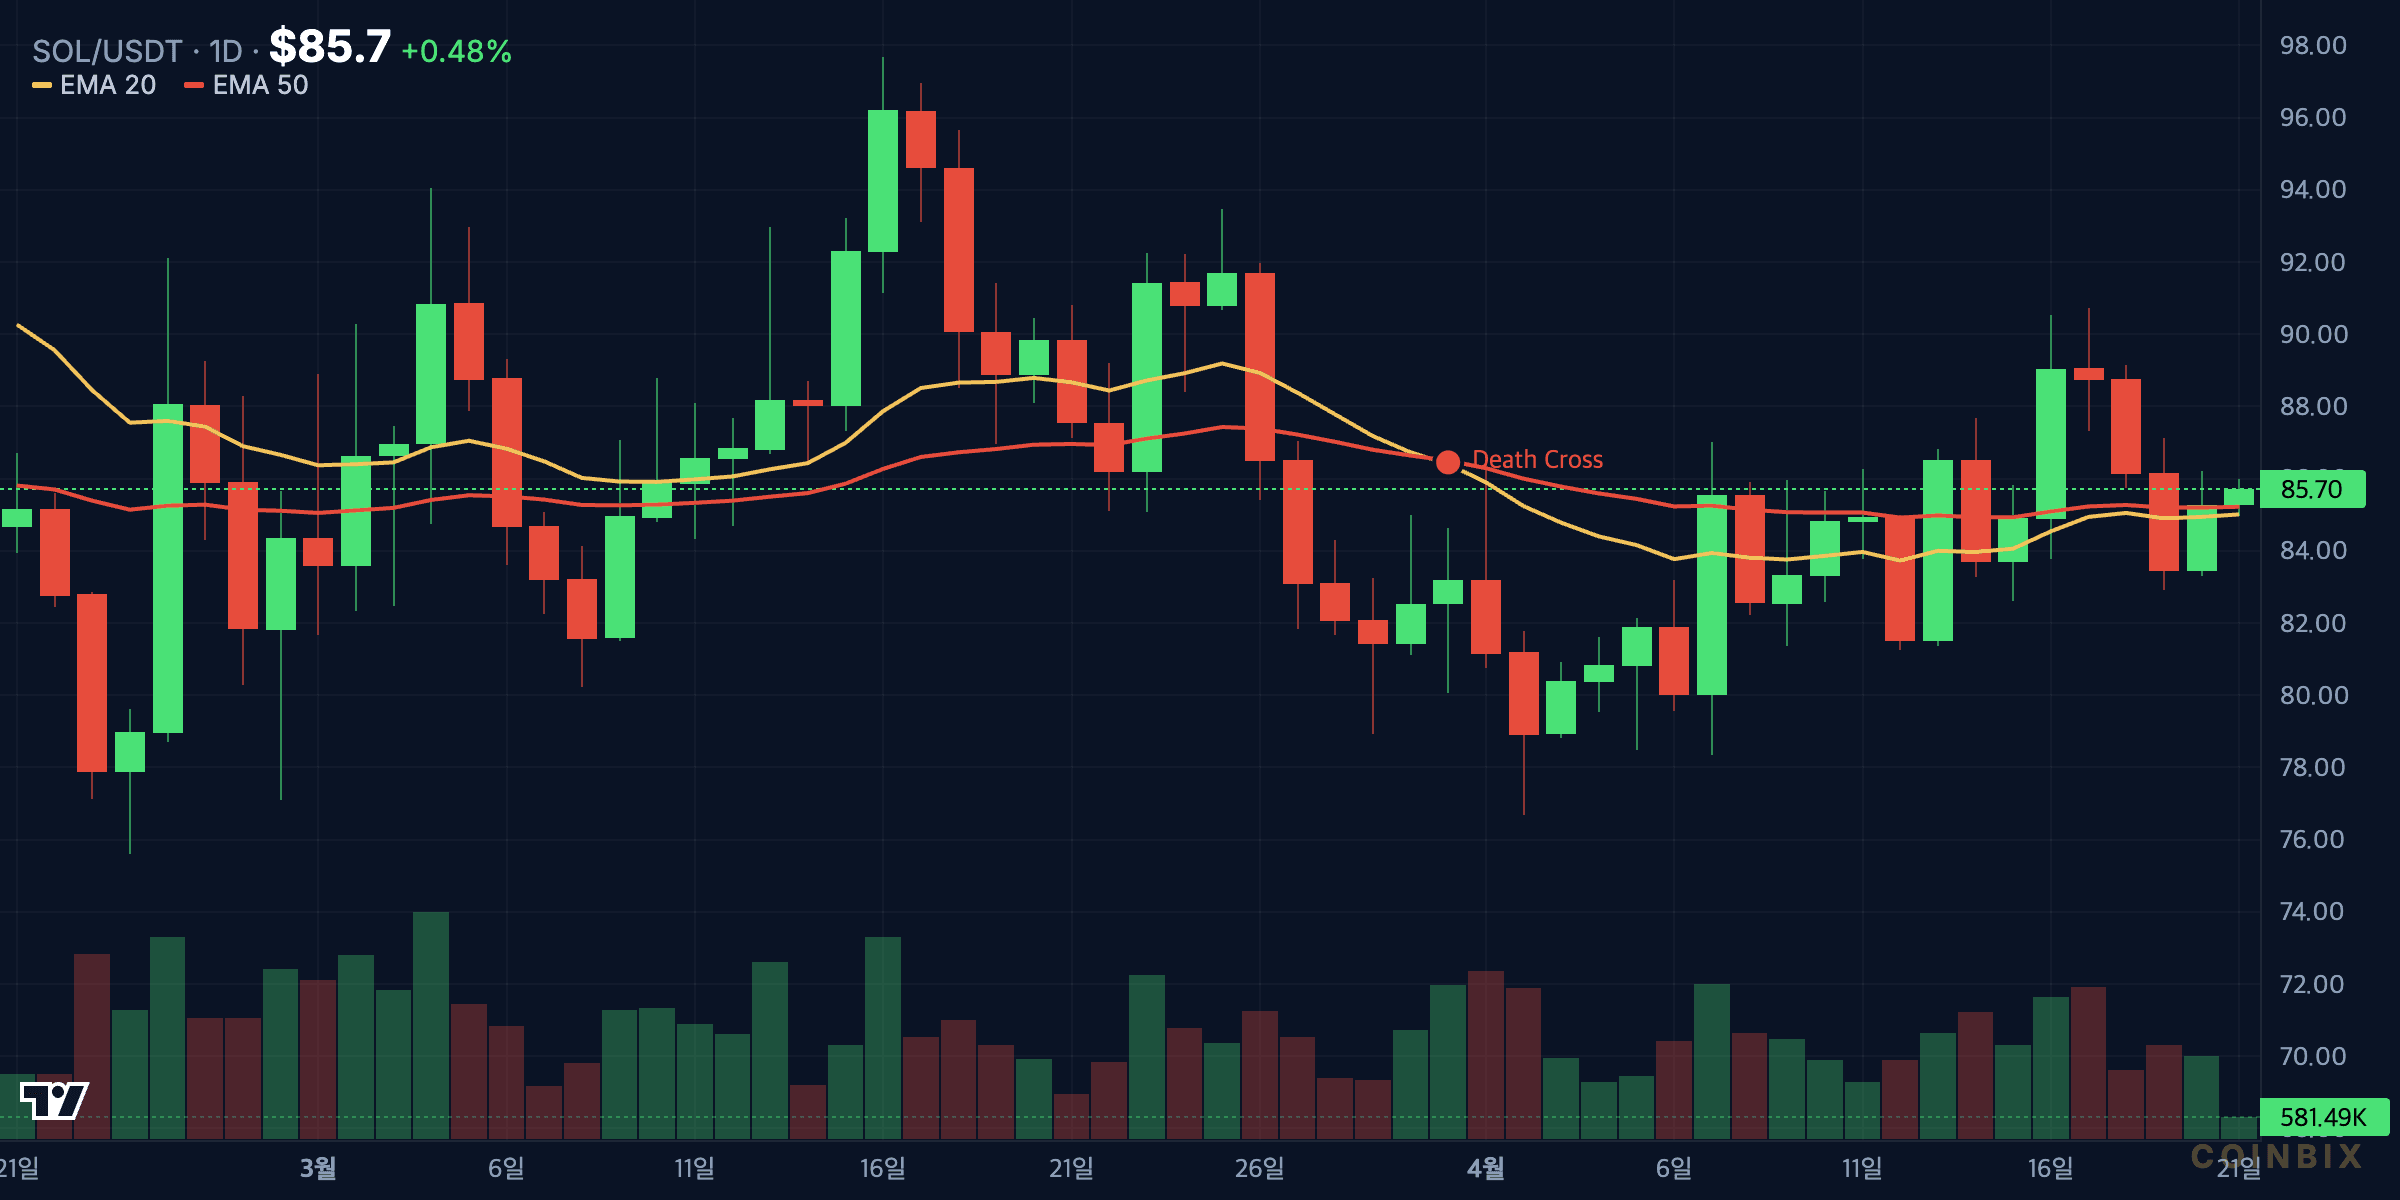
Solana enters the week with the weakest near-term technical posture of the three assets covered here. Cointelegraph notes that SOL fell below its moving averages on Sunday, a sign that higher prices continue to attract supply. When an asset trades under flattened moving averages while RSI hovers near the midpoint, the chart usually reflects indecision rather than trend strength. That does not automatically mean a breakdown is imminent, but it does mean buyers have less control than they do in Bitcoin.
The first downside level to watch is $76. If SOL remains below the moving averages, bears will likely keep pressing toward that support. This is a meaningful level because repeated tests of horizontal support tend to weaken it. The more often buyers have to defend the same line, the more likely it is that liquidity eventually dries up and the market breaks through. If $76 fails, Solana could quickly transition from consolidation into another downside leg.
The bullish roadmap is also clearly defined. Buyers need to reclaim $90 first, which would signal that the recent breakdown below the averages was more of a shakeout than a structural rejection. Beyond that, $98 is the real decision point. Cointelegraph argues that a close above $98 could open the way toward $117, and that is a reasonable projection because it would represent a break from the current neutral zone and a shift back toward trend continuation.
Compared with Bitcoin and Ether, Solana has a narrower margin for error. BTC is sitting above dynamic support, ETH is testing support inside a known range, but SOL has already slipped to the wrong side of its short-term trend markers. That places more pressure on buyers to respond quickly. If they do not, the path of least resistance stays sideways to lower.
How much do macro signals matter for crypto this week?
The chart setups cannot be separated from the macro backdrop. Cointelegraph’s report pairs crypto price action with two non-crypto signals, the S&P 500 near record highs and the US Dollar Index holding within a broader range after turning down from its 20-day EMA. That combination is relevant because crypto generally benefits when the dollar stops strengthening and equity risk appetite remains stable.
The S&P 500 recently pushed to a fresh all-time high at 7,147 before entering overbought territory on the daily RSI, while DXY turned lower from its 20-day EMA and moved back toward 97.74 support. That mix is generally supportive for crypto because it suggests risk appetite is intact and dollar pressure is not intensifying. The main caveat is geopolitical risk. Cointelegraph notes that worsening conflict around the US-Iran ceasefire could unwind the recent bullish move, which is why near-term support levels in BTC, ETH, and SOL matter so much.
Which chart has the best risk-reward setup now?
If risk-reward is defined by clarity of levels and evidence of dip demand, Bitcoin has the best setup. It is holding above its 20-day EMA, it has a clearly identified resistance band, and it is supported by fresh institutional demand signals including ETF inflows and Strategy’s balance-sheet accumulation. That does not make BTC risk-free, but it gives traders the cleanest structure to work with.
Ethereum ranks second because its range is well defined, but the market has not yet shown enough strength to break the ceiling. For swing traders, ETH may become attractive only after confirmation above $2,415. Before that, it remains vulnerable to another failed push inside the same range.
Solana ranks third on the current chart evidence because it has already lost short-term trend support. Its upside could still be sharp if $90 and then $98 are reclaimed, but until that happens the chart asks traders to bet on recovery before evidence arrives. Bitcoin is closest to an upside continuation, Ethereum is waiting for confirmation, and Solana needs repair work before it can compete with the leaders.
Conclusion: watch support first, then chase strength
The most disciplined read of the April 20 setup is that crypto remains constructive but still headline-sensitive. Bitcoin continues to lead after defending its 20-day EMA and could accelerate if it closes above $78,333. Ethereum is stable but boxed in, with $2,415 still acting as the gatekeeper to a larger recovery. Solana is the most vulnerable chart in the group because it has slipped below its moving averages and now needs a fast reclaim of $90 to reset bullish momentum.
For this week, the market signal is less about prediction and more about validation. If support levels hold and overhead resistance starts to give way, the relief rally can extend. If those supports fail, the recent bounce will start to look like another temporary reprieve inside broader consolidation. In a macro environment shaped by ETF flows, equity strength, dollar softness, and geopolitical uncertainty, technical discipline remains the most reliable edge.
Bybit 20% Fee Discount
Free Coinbix Premium Channel
FAQ
Is Bitcoin the strongest setup among BTC, ETH, and SOL?
Yes, based on the April 20 chart structure, Bitcoin looks strongest because it held above its 20-day EMA near $72,832 and is closer to an upside breakout than the others. A close above the $76,000 to $78,333 resistance zone would strengthen that view.
What level matters most for Ethereum this week?
The key level is $2,415. If Ether closes above that resistance after holding the 20-day EMA near $2,252, the path toward $2,800 becomes more credible. If it fails, the broader $1,916 to $2,415 range likely remains in place.
Why is Solana considered weaker in this analysis?
Solana slipped below its moving averages, which shows that rallies are still being sold. Unless buyers reclaim $90 and then break $98, the chart remains vulnerable to a retest of $76 support.
How do ETF inflows affect this outlook?
ETF inflows matter because they show institutional demand is still active. Cointelegraph cited $996 million in weekly US spot Bitcoin ETF inflows, which supports the idea that Bitcoin buyers are stepping in on weakness rather than exiting the market.
What could invalidate the bullish case for all three assets?
A failure to hold near-term support, combined with a macro risk shock such as worsening geopolitical tension, would weaken the bullish case. In that scenario, Bitcoin could lose its breakout structure, Ethereum could remain trapped in range, and Solana could extend lower.
Related coverage: Brent Oil Tops $100 After US-Iran Talks Collapse | Iran Rejects U.S. Talks as Retaliation Risk Rises
Price Targets Comparison
| Asset | Current | Support | Resistance | Target (1M) |
|---|---|---|---|---|
| BTC | $78,200 | $72,000 | $84,500 | $95,000 |
| ETH | $3,420 | $3,150 | $3,800 | $4,200 |
| SOL | $185 | $172 | $205 | $240 |
| XRP | $1.42 | $1.28 | $1.55 | $1.80 |
Affiliate Disclosure: This page contains affiliate links. Coinbix may earn a commission at no extra cost to you.
Disclaimer: This article is for informational purposes only and does not constitute financial advice. Cryptocurrency investments carry significant risk. Always conduct your own research before making investment decisions.