Key Takeaways
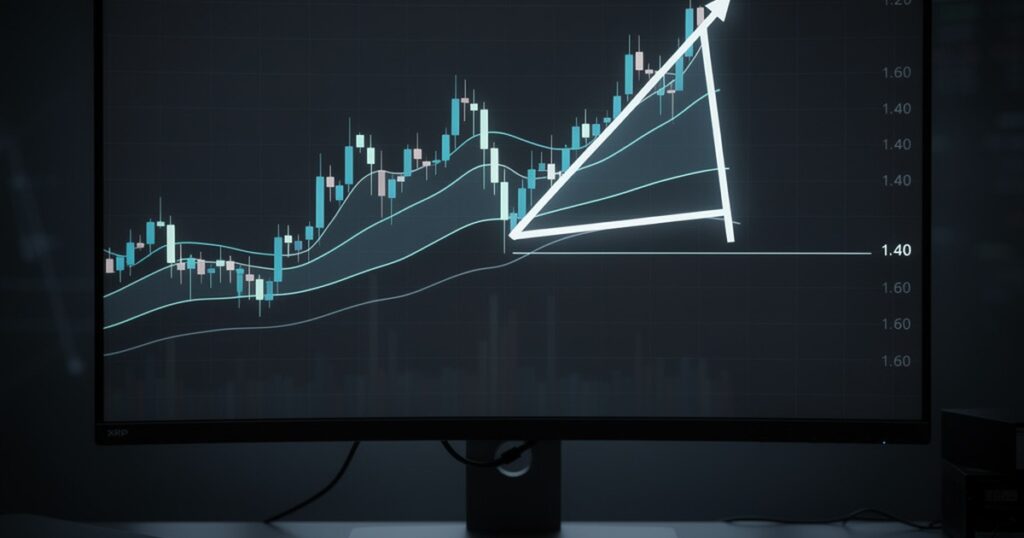
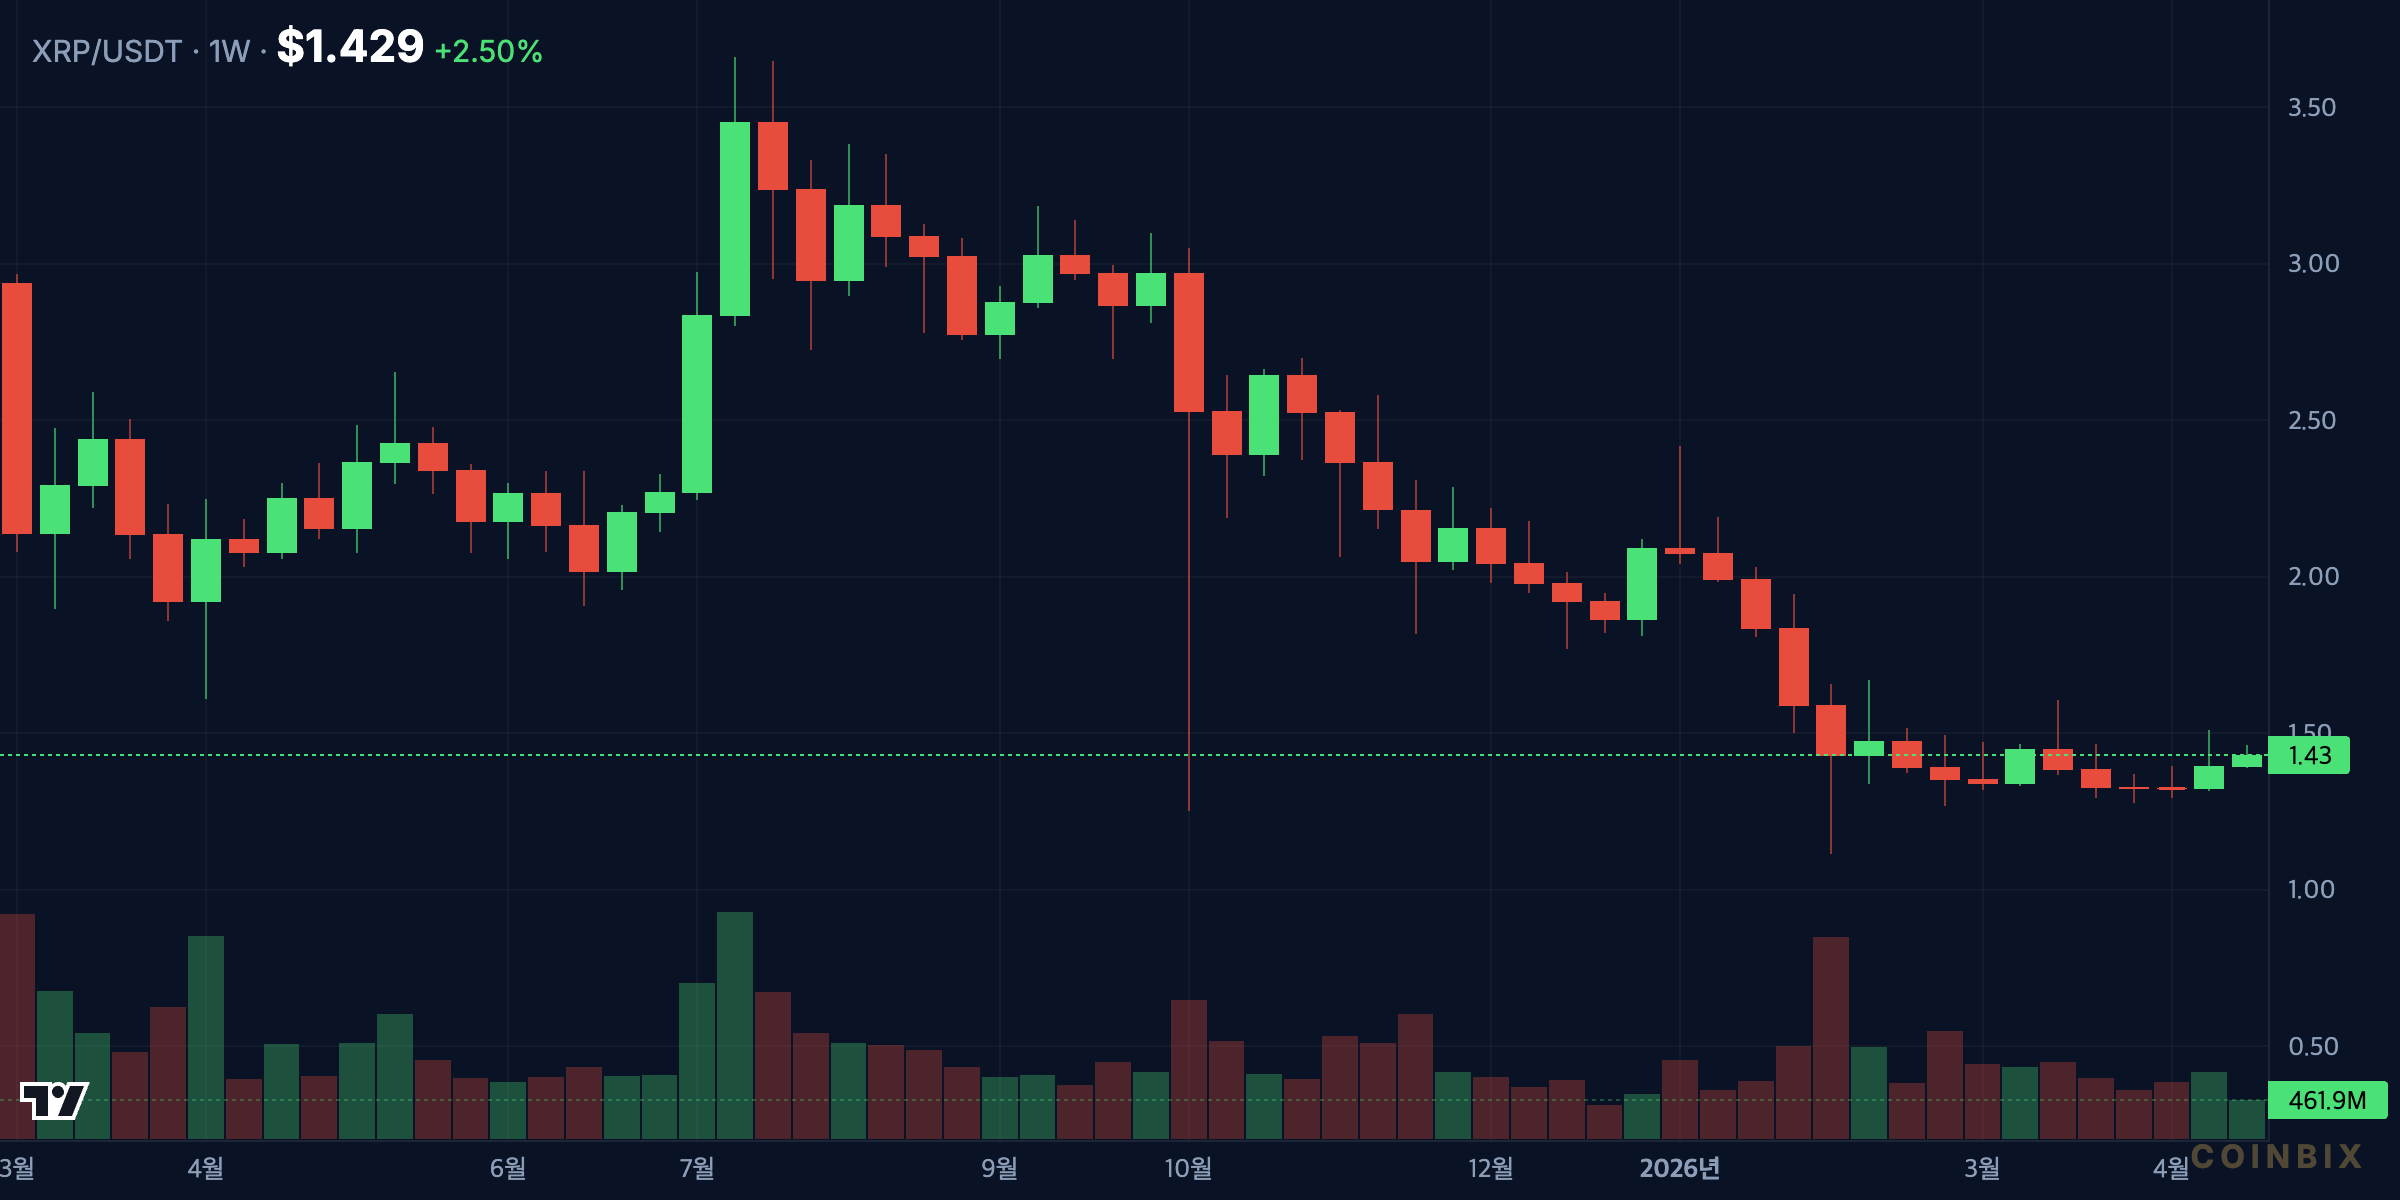
- ■ XRP is trading near $1.44 while a symmetrical triangle squeeze narrows the range between rising support and falling resistance.
- ▲ A daily close above the $1.50-$1.52 resistance area would improve the probability of a measured move toward $1.62 and $1.72.
- ▼ A failure below $1.36-$1.38 would weaken the pattern and expose deeper support near $1.28 and $1.20.
- ■ EMA convergence and muted volume suggest compression, not confirmation; direction depends on the first high-volume break.
XRP is entering a technical decision zone. According to a CoinDesk market report, the Ripple-linked token has stalled near $1.44 while price action forms a triangle squeeze that analysts are watching for a potential breakout. The setup matters because compression patterns often precede expansion: volatility contracts, moving averages bunch together, volume becomes selective, and the market waits for one side to force a close outside the structure.
For XRP, the important point is not simply that price is quiet. It is that quiet price action is developing near a level where both bulls and bears can define risk clearly. Above the range, resistance near $1.50-$1.52 represents the ceiling the market has failed to clear. Below the range, the $1.36-$1.38 area has become the support shelf that keeps the pattern alive. The next decisive daily candle could therefore carry more information than several sessions of sideways movement.
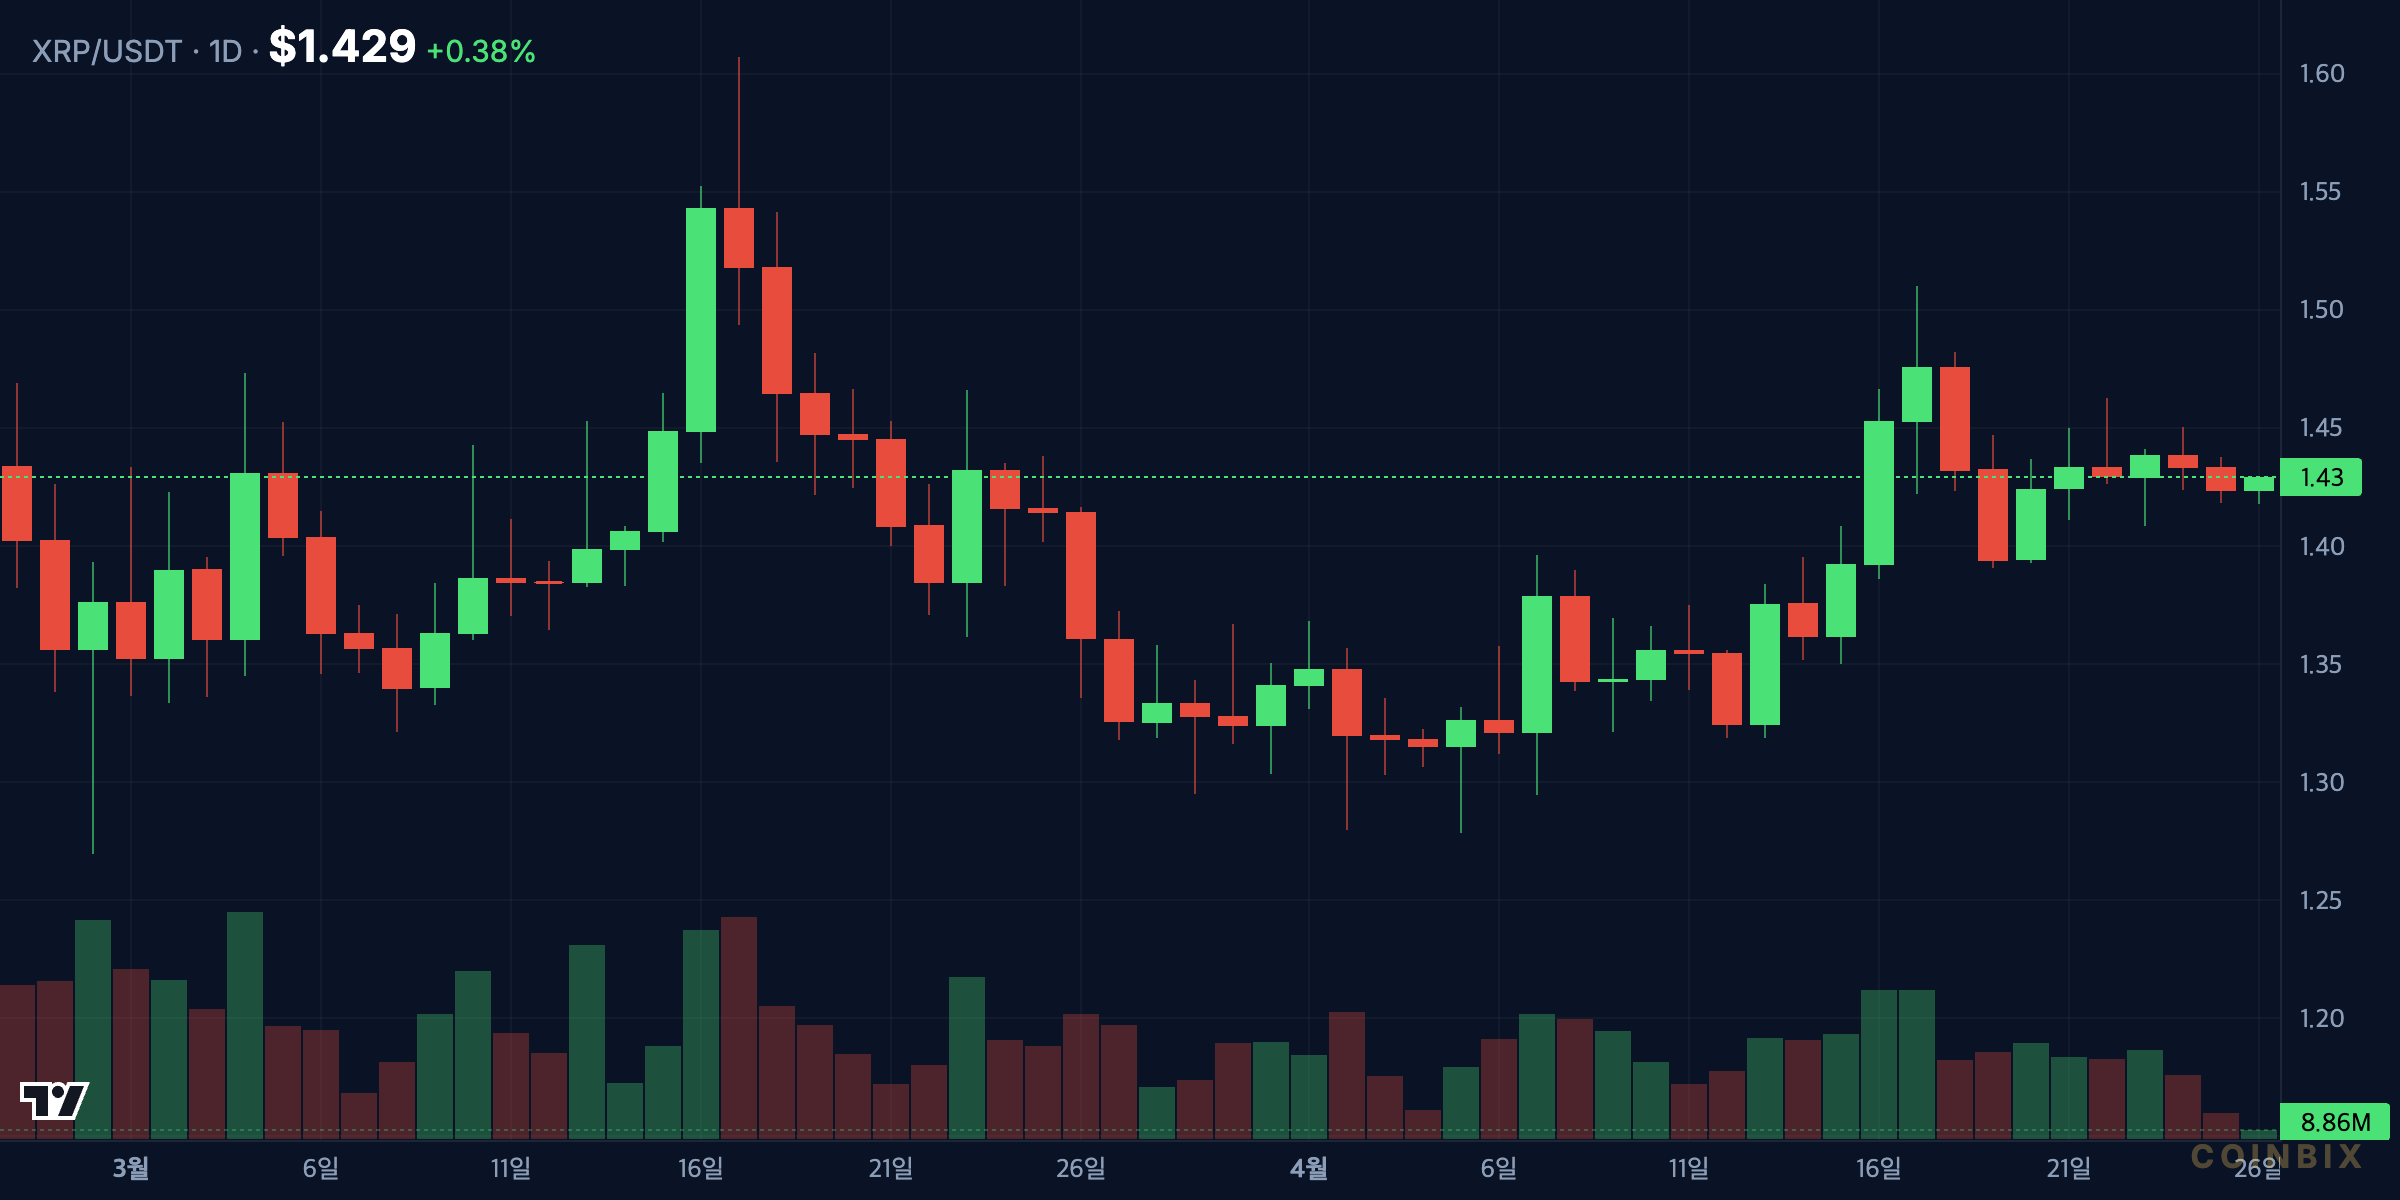
XRP Market Summary: Compression Around $1.44
XRP’s current structure is best understood as a volatility compression phase rather than a confirmed trend reversal. Price near $1.44 sits between two competing zones: lower highs that show sellers are defending rallies, and higher lows that show dip demand remains present. This balance creates the symmetrical triangle shape now dominating the chart.
In a symmetrical triangle, the market is not making a strong directional statement. Instead, it is removing excess volatility. Each rally fades sooner than the prior rally, while each pullback finds support sooner than the prior pullback. That is why the apex of the pattern becomes important. As price approaches the point where the two trendlines converge, the available range narrows and the next impulsive move becomes harder to delay.
The daily chart is the primary map for this setup. If XRP can close above the upper boundary with expanding volume, the pattern would shift from compression to upside continuation. If price loses the lower boundary on stronger selling pressure, the triangle becomes a failed consolidation and the market may reprice toward lower support.
What Does the Triangle Squeeze Say About XRP?
The triangle squeeze says that the market is preparing for a directional choice but has not yet made one. In practical terms, XRP is compressing between a resistance band around $1.50-$1.52 and a support band around $1.36-$1.38. These levels are not just static price points; they define the behavior of market participants.
The upper boundary reflects supply. Each approach to that region has attracted selling or profit-taking, preventing XRP from establishing a higher high. The lower boundary reflects demand. Each dip into that area has found buyers willing to defend the structure, preventing a full breakdown. This tug-of-war is why symmetrical triangles are often described as neutral until broken.
On the downside, a break below $1.36-$1.38 would put pressure on the short-term structure. The first area to monitor would be $1.28, where buyers may attempt to rebuild a base. If that fails, the next broader support zone near $1.20 becomes more relevant. A move into that zone would imply that the triangle did not resolve as accumulation but instead acted as distribution before another leg lower.
The most important detail is confirmation. A triangle break with low volume is vulnerable to reversal. A break with rising volume, a wide candle body, and limited immediate retracement is more credible. XRP needs that type of confirmation before the pattern can be treated as a completed signal.
 Bybit 20% Fee Discount
Free Coinbix Premium Channel
EMA Convergence Shows Why Momentum Is Waiting
Moving averages help explain why XRP has not yet chosen direction. During strong trends, short-term exponential moving averages separate clearly from medium-term averages, showing persistent momentum. During compression, those averages flatten and move closer together. That is the current message from the setup: momentum is narrowing, not accelerating.
EMA convergence near the middle of the triangle usually means the market is treating current price as fair value. Buyers are not yet paying aggressively above resistance, and sellers are not yet pressing hard below support. This creates a cluster of moving averages that can act as a springboard once price escapes the range.
For a bullish reading, XRP would ideally reclaim and hold above the short-term EMA cluster, then push through the triangle ceiling with a candle close above $1.50-$1.52. If that happens while the faster EMA starts turning higher and separating from the slower EMA, momentum would begin confirming price. The cleaner version of the signal would be a breakout, a retest of the former ceiling, and renewed buying pressure from that retest.
For a bearish reading, the opposite matters. A close below the lower boundary followed by the short-term EMA rolling beneath the medium-term EMA would suggest that sellers have gained control. In that case, rallies back toward the broken support zone could become lower-risk rejection areas for bears, while bulls would need to recover the range quickly to neutralize the damage.
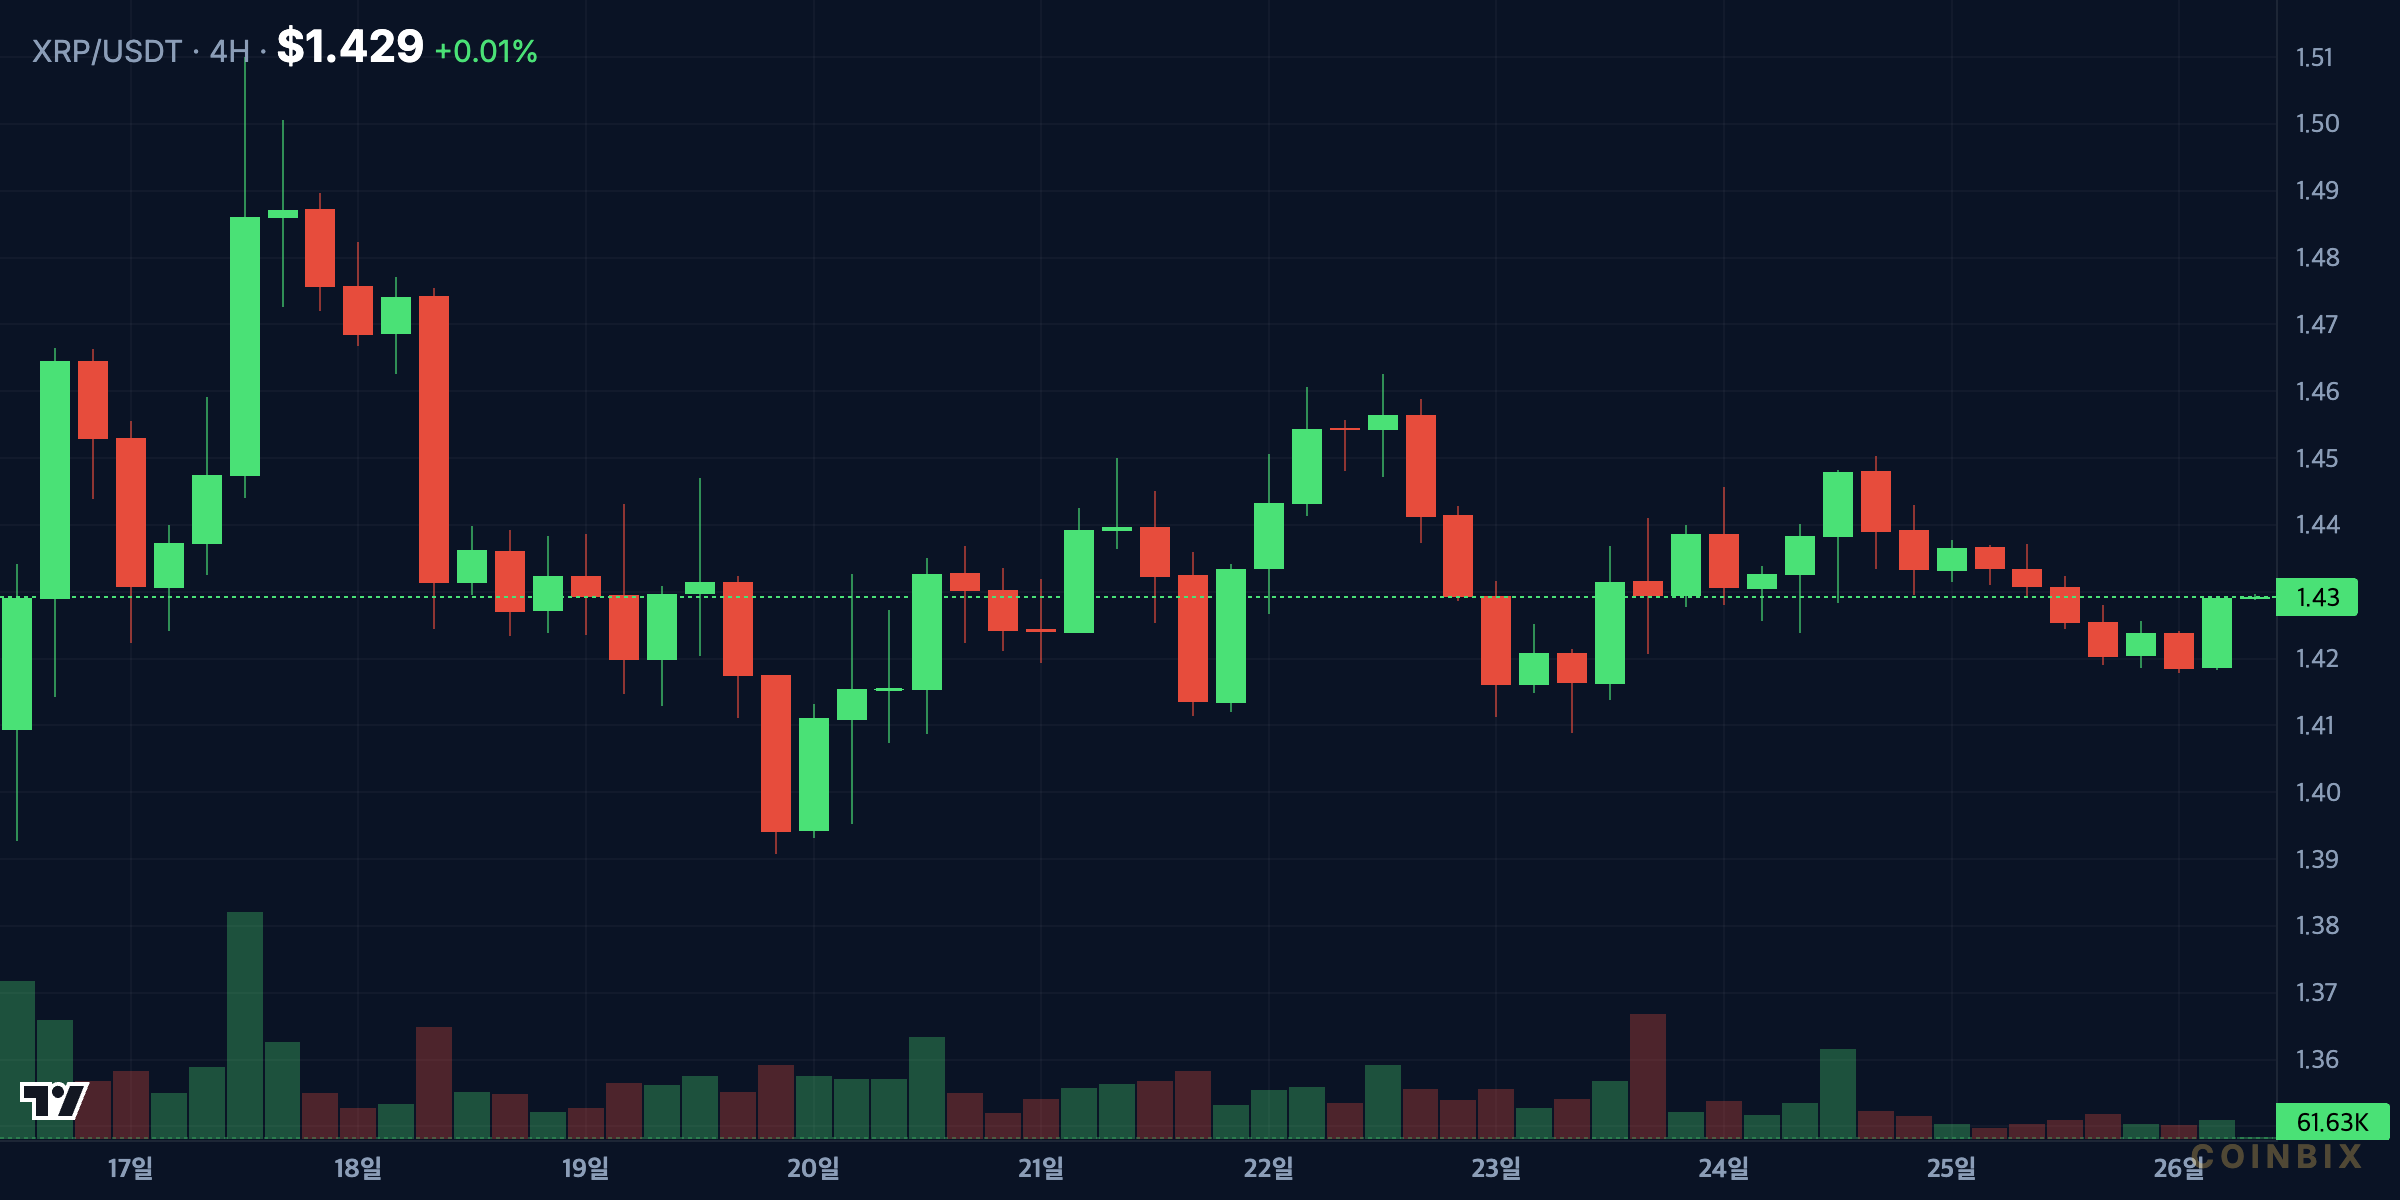
The 4-hour chart is useful because it shows the mechanics of the squeeze more clearly than the daily chart. It can reveal whether the pattern is producing higher lows, whether candles are respecting the trendlines, and whether volume expands on breakout attempts. Still, the daily close remains the stronger filter.
Volume Analysis: The Breakout Needs Participation
Volume is the difference between a real breakout and a temporary price excursion. In a triangle squeeze, volume often fades as the pattern matures because fewer market participants are willing to act before direction is confirmed. That fading activity is normal. What matters is whether volume returns when price challenges the boundary.
An upside breakout above $1.50-$1.52 would be more convincing if volume rises above recent averages and the candle body closes near the upper part of the session range. That combination would show commitment rather than hesitation. It would also indicate that sellers near resistance were absorbed rather than merely avoided by a thin liquidity spike.
This is why XRP’s next move should be judged by price, volume, and close quality together. Price alone can mislead during a squeeze. Volume alone can spike during news-driven noise. A confirmed close outside the range with expanding participation is the cleaner technical signal.
Upside Scenario: $1.50 Break Opens the Target Map
The bullish scenario begins with XRP closing above the $1.50-$1.52 resistance band. This would mark a break of the descending trendline that has capped rallies and would shift attention toward measured-move targets. The first upside checkpoint would be $1.62, where short-term profit-taking could appear. If momentum remains constructive, $1.72 becomes the next extension zone.
Momentum indicators would also need to support the move. A rising relative strength profile, a fast EMA turning higher, and positive follow-through on the 4-hour chart would make the upside case more durable. Without those elements, XRP could still break higher, but the probability of a quick fade would increase.
The weekly chart provides the larger context. A daily breakout that also improves the weekly structure would carry more weight than a short-lived intraday move. If XRP can finish the week above the triangle ceiling, the market would have a broader timeframe confirmation that buyers are willing to accept higher prices.
Downside Scenario: Failed Support Changes the Pattern
The bearish scenario begins with a close below $1.36-$1.38. That would break the rising support line and invalidate the main feature that has kept the triangle constructive. Once higher lows fail, the market stops treating the structure as balanced and starts looking for the next demand zone.
The first downside reference would be $1.28. This area matters because it gives buyers a nearby level to defend after a failed squeeze. If XRP stabilizes there and quickly reclaims the triangle, the breakdown could prove false. If price slices through $1.28 with volume, the next wider support near $1.20 becomes more important.
Risk also comes from failed upside attempts. A breakout above $1.50 that cannot hold, especially if followed by a close back inside the triangle, would be a warning sign. Failed breakouts often create sharp reversals because buyers who entered late are forced to exit while sellers regain confidence. In that case, the market may move rapidly back toward the lower boundary.
Conclusion: XRP Needs a Clean Close, Not Just a Spike
XRP’s triangle squeeze near $1.44 is a high-information setup because the market has compressed into a narrow, well-defined range. The bullish path requires a daily close above $1.50-$1.52, expanding volume, and ideally a successful retest of the breakout area. If that sequence develops, $1.62 and $1.72 become reasonable technical objectives.
The bearish path is equally clear. A close below $1.36-$1.38 would damage the higher-low structure and shift focus toward $1.28, then $1.20 if selling pressure accelerates. In that scenario, the triangle would no longer represent potential accumulation; it would represent failed compression.
Until one boundary breaks with confirmation, the correct reading is disciplined neutrality. XRP is not yet showing a completed breakout, but it is close enough to the apex that the next confirmed daily move may define the next several sessions. For analysts, the key is to avoid overreacting to wicks and focus on closing price, volume expansion, EMA behavior, and retest quality.
Bybit 20% Fee Discount
Free Coinbix Premium Channel
FAQ
What is the XRP triangle squeeze?
The XRP triangle squeeze is a compression pattern where price forms lower highs and higher lows inside a narrowing range. In this setup, resistance is near $1.50-$1.52 while support is near $1.36-$1.38.
Which XRP level confirms an upside breakout?
A daily close above $1.50-$1.52 would be the main upside confirmation. The signal would be stronger if volume expands and XRP later holds that zone as support during a retest.
What levels matter if XRP breaks down?
If XRP closes below $1.36-$1.38, the first support area to monitor is near $1.28. If selling pressure continues, the broader support zone near $1.20 becomes the next downside reference.
Why does volume matter in this pattern?
Volume shows whether the breakout has real participation. A move outside the triangle on weak volume can reverse quickly, while a high-volume close outside the range gives the signal more credibility.
Is XRP bullish or bearish right now?
The current setup is neutral until confirmed. The structure has bullish potential above resistance and bearish risk below support, but the next daily close outside the triangle is the key signal.
Affiliate Disclosure: This page contains affiliate links. Coinbix may earn a commission at no extra cost to you.
Disclaimer: This article is for informational purposes only and does not constitute financial advice. Cryptocurrency investments carry significant risk. Always conduct your own research before making investment decisions.