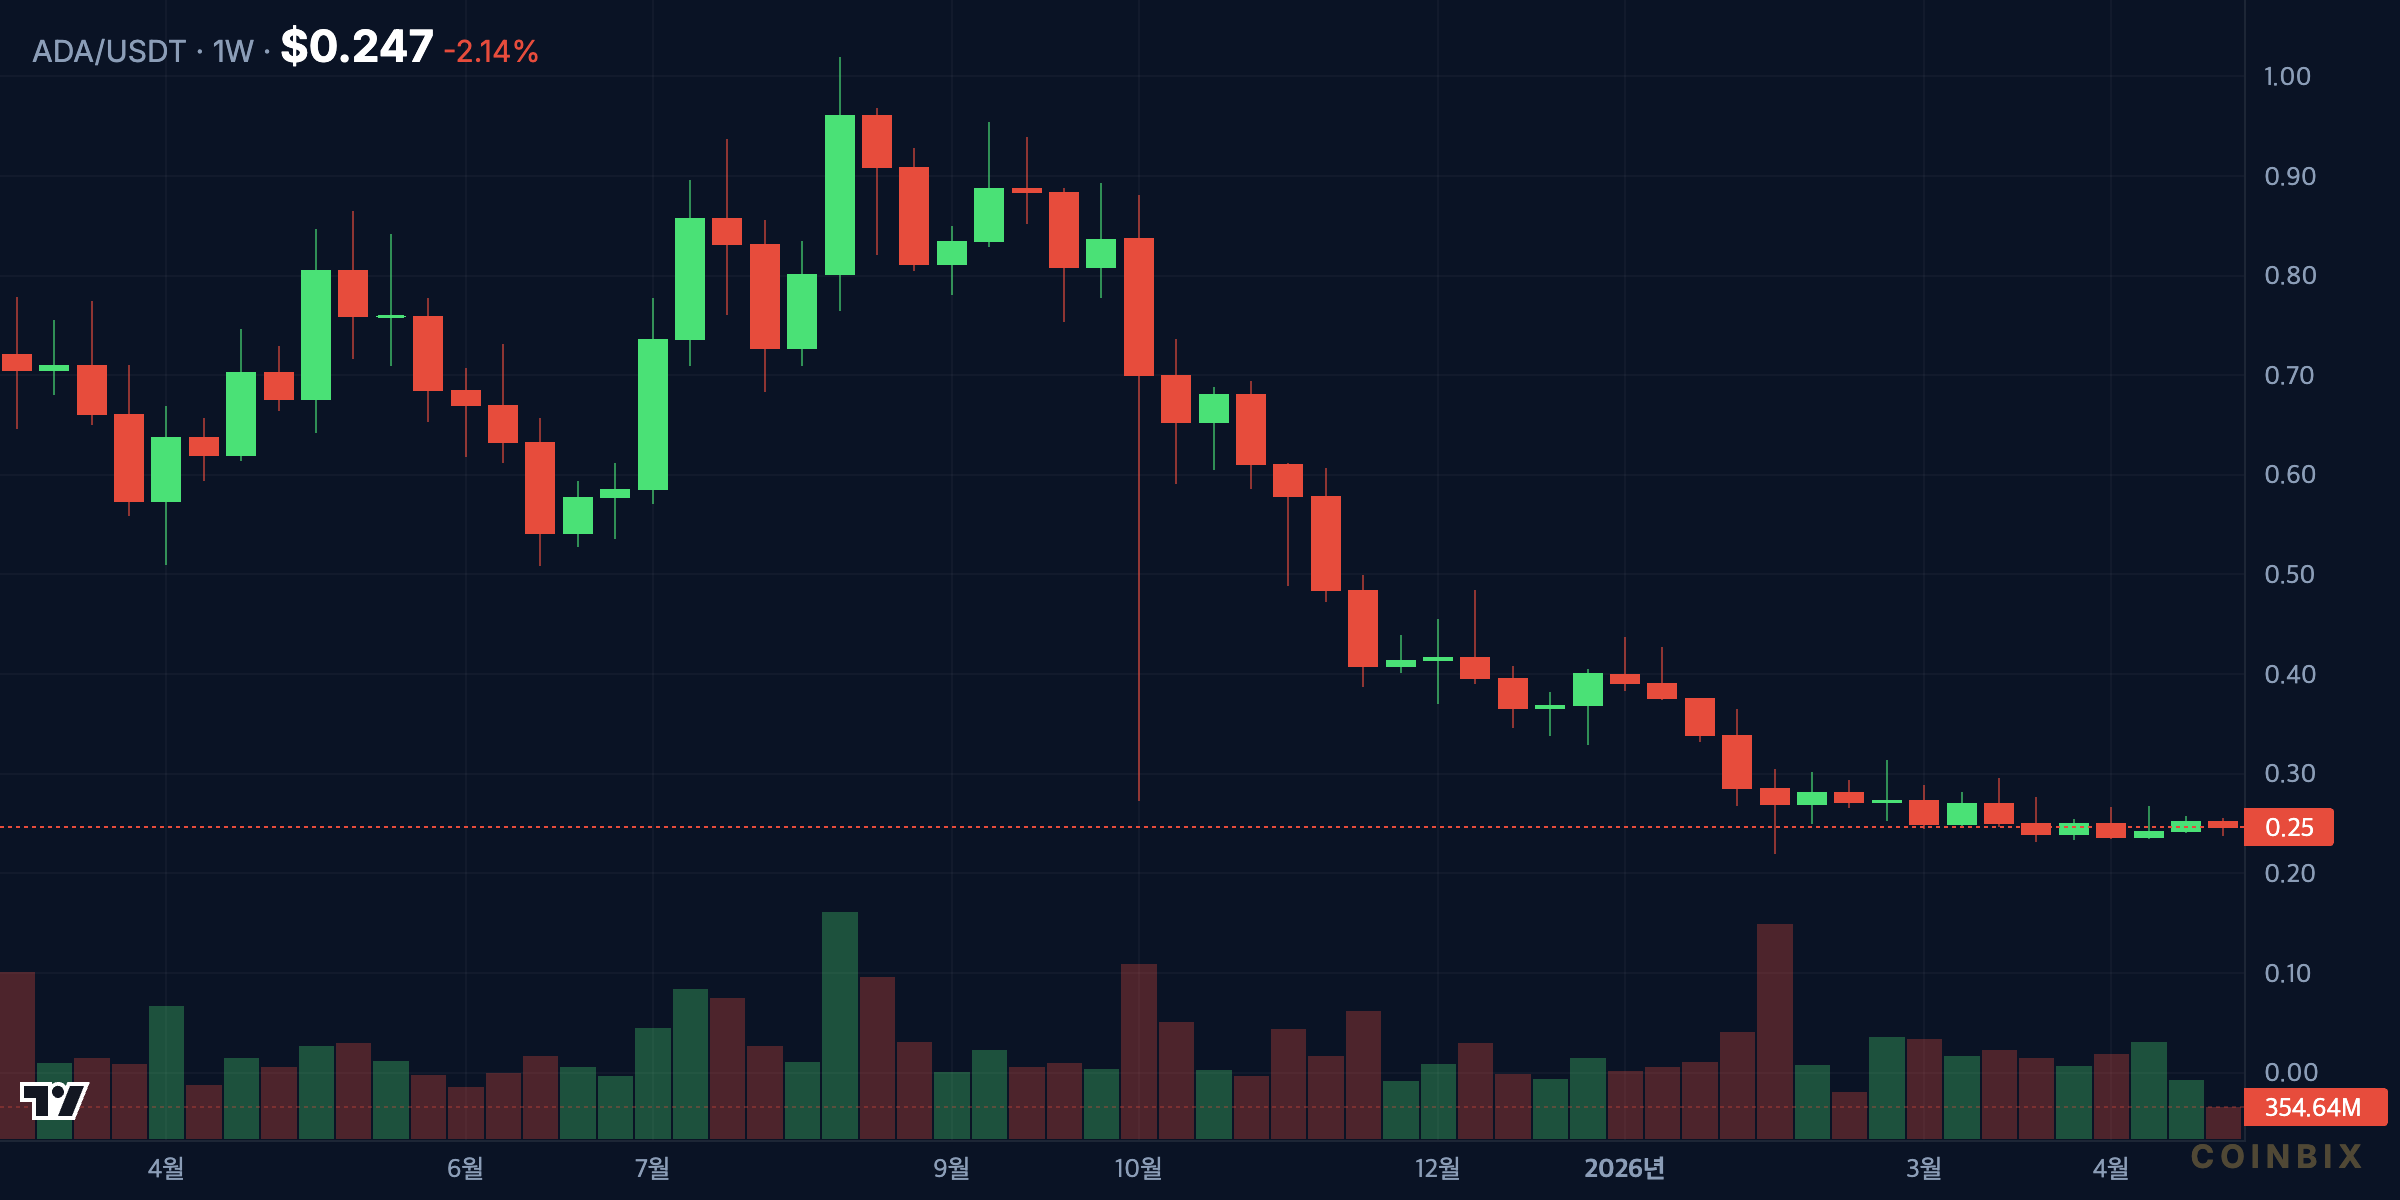
Inspired by TradingView trader @without_worries’s idea: source. This ADA price analysis uses fresh CoinGecko market data and Bybit ADAUSDT candles, not the TradingView body, chart, or image, to assess whether Cardano can first rebuild toward $0.50 and what would need to change before any larger-cycle target becomes credible.
Key Takeaways
- ▼ ADA remains below its 20-day, 50-day, 100-day, and 200-day EMAs, leaving the medium-term trend defensive despite short-term stabilization near $0.24-$0.25.
- ▲ Weekly MACD histogram is improving and the $0.2206-$0.2328 zone has repeatedly attracted demand, giving bulls a defined base to defend.
- ■ A realistic $0.50 path requires daily closes above $0.295-$0.314 first, then a volume-backed reclaim of the $0.37-$0.44 weekly supply band.
Why ADA’s $0.50 Question Matters Now
Cardano is trading near $0.247 on Bybit spot data, while CoinGecko shows ADA around $0.2466, a market cap near $9.12 billion, and 24-hour volume around $476.6 million. That keeps ADA ranked inside the large-cap crypto set, but the price structure is far from euphoric: ADA is down roughly 64.6% over one year and remains about 92.0% below its $3.09 all-time high.
The relevance of the $0.50 level is not just psychological. On the weekly chart, $0.50 sits close to the breakdown zone from late 2025, near the area where ADA lost momentum after trading above $0.60 and briefly above $1.00 earlier in the previous cycle. A recovery to $0.50 would therefore be more than a bounce; it would signal that Cardano has absorbed a major supply shelf and restored a mid-cycle trend profile.
What Does the Current ADA Market Data Say?
CoinGecko reports Cardano’s circulating supply near 36.97 billion ADA against a maximum supply of 45.00 billion ADA. At $0.2466, that produces a market cap near $9.12 billion and a fully diluted valuation near $11.10 billion. A move to $0.50 would imply a circulating market cap around $18.5 billion, before accounting for supply changes. A move to $10 would imply roughly $369.7 billion on circulating supply, making it a full-cycle institutional repricing rather than a simple technical target.
Short-term performance is mixed rather than decisive. ADA is down about 1.2% over 24 hours, almost flat over seven days, down 1.4% over 14 days, and up only 0.4% over 30 days, while the 60-day change is still negative at about 12.7%. That profile describes compression: sellers have not forced a fresh collapse, but buyers have not yet created a broad trend reversal.
Volume also argues for patience. Bybit daily candle data shows the latest daily volume at only about 0.23 times the 20-day average. That can be partly explained by an incomplete candle, but it still matters for confirmation. In a credible reversal, traders normally want to see expanding volume as price clears resistance. ADA has not yet delivered that kind of volume signature on the daily timeframe.
Can ADA Build a Short-Term Base Above $0.24?
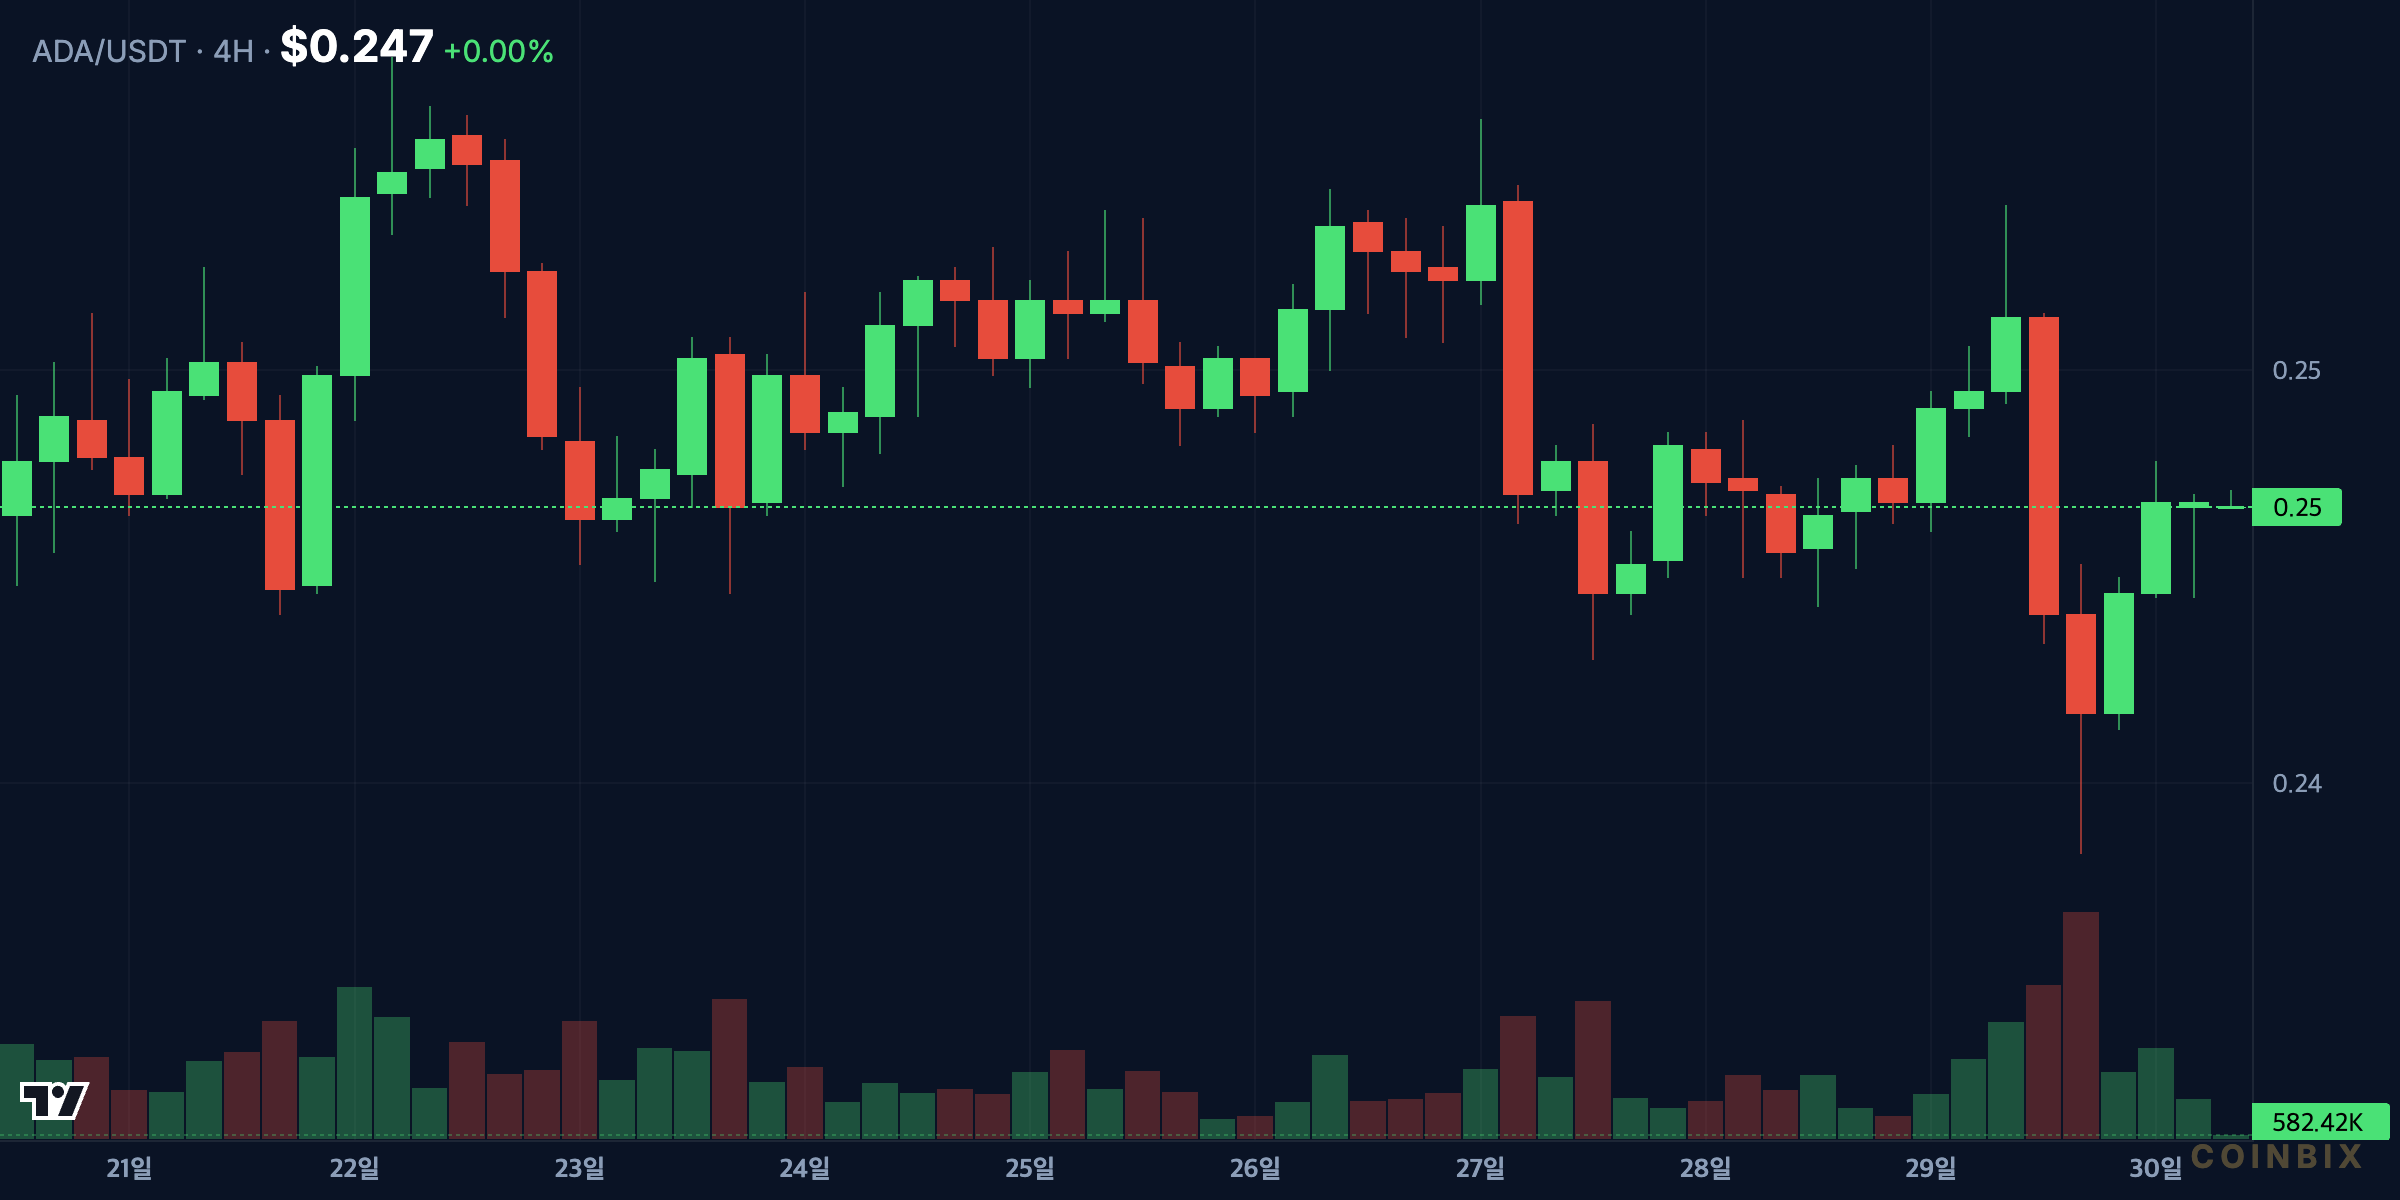
The 4-hour chart is the first place to look for early rotation. ADA’s latest 4-hour close near $0.247 sits almost exactly on the 20-period EMA near $0.2472, but still below the 50-period EMA near $0.2484, 100-period EMA near $0.2489, and 200-period EMA near $0.2505. That cluster creates a narrow decision zone: reclaiming $0.250-$0.255 would start to improve short-term structure, while rejection there keeps ADA trapped in a low-volatility range.
Momentum is neutral. The 4-hour RSI is around 48.6, close to the midpoint, while MACD is nearly flat with a histogram just above zero. This is not a bearish acceleration signal, but it is also not an impulse signal. It indicates balance after selling pressure, where the next high-volume break is likely more important than the current oscillator reading.
Support is clearly defined. Over the last 20 to 50 4-hour candles, ADA’s low is $0.2384 and the local high is $0.2575. A sustained break below $0.238 would expose the prior daily demand band near $0.2328 and then the broader weekly low near $0.2206. Conversely, a move above $0.2575 would put the $0.2679-$0.2768 range back into focus, where previous daily and weekly highs have capped rallies.
 Bybit 20% Fee Discount
Free Coinbix Premium Channel
Daily Trend: Reversal Attempt or Bear-Market Pause?
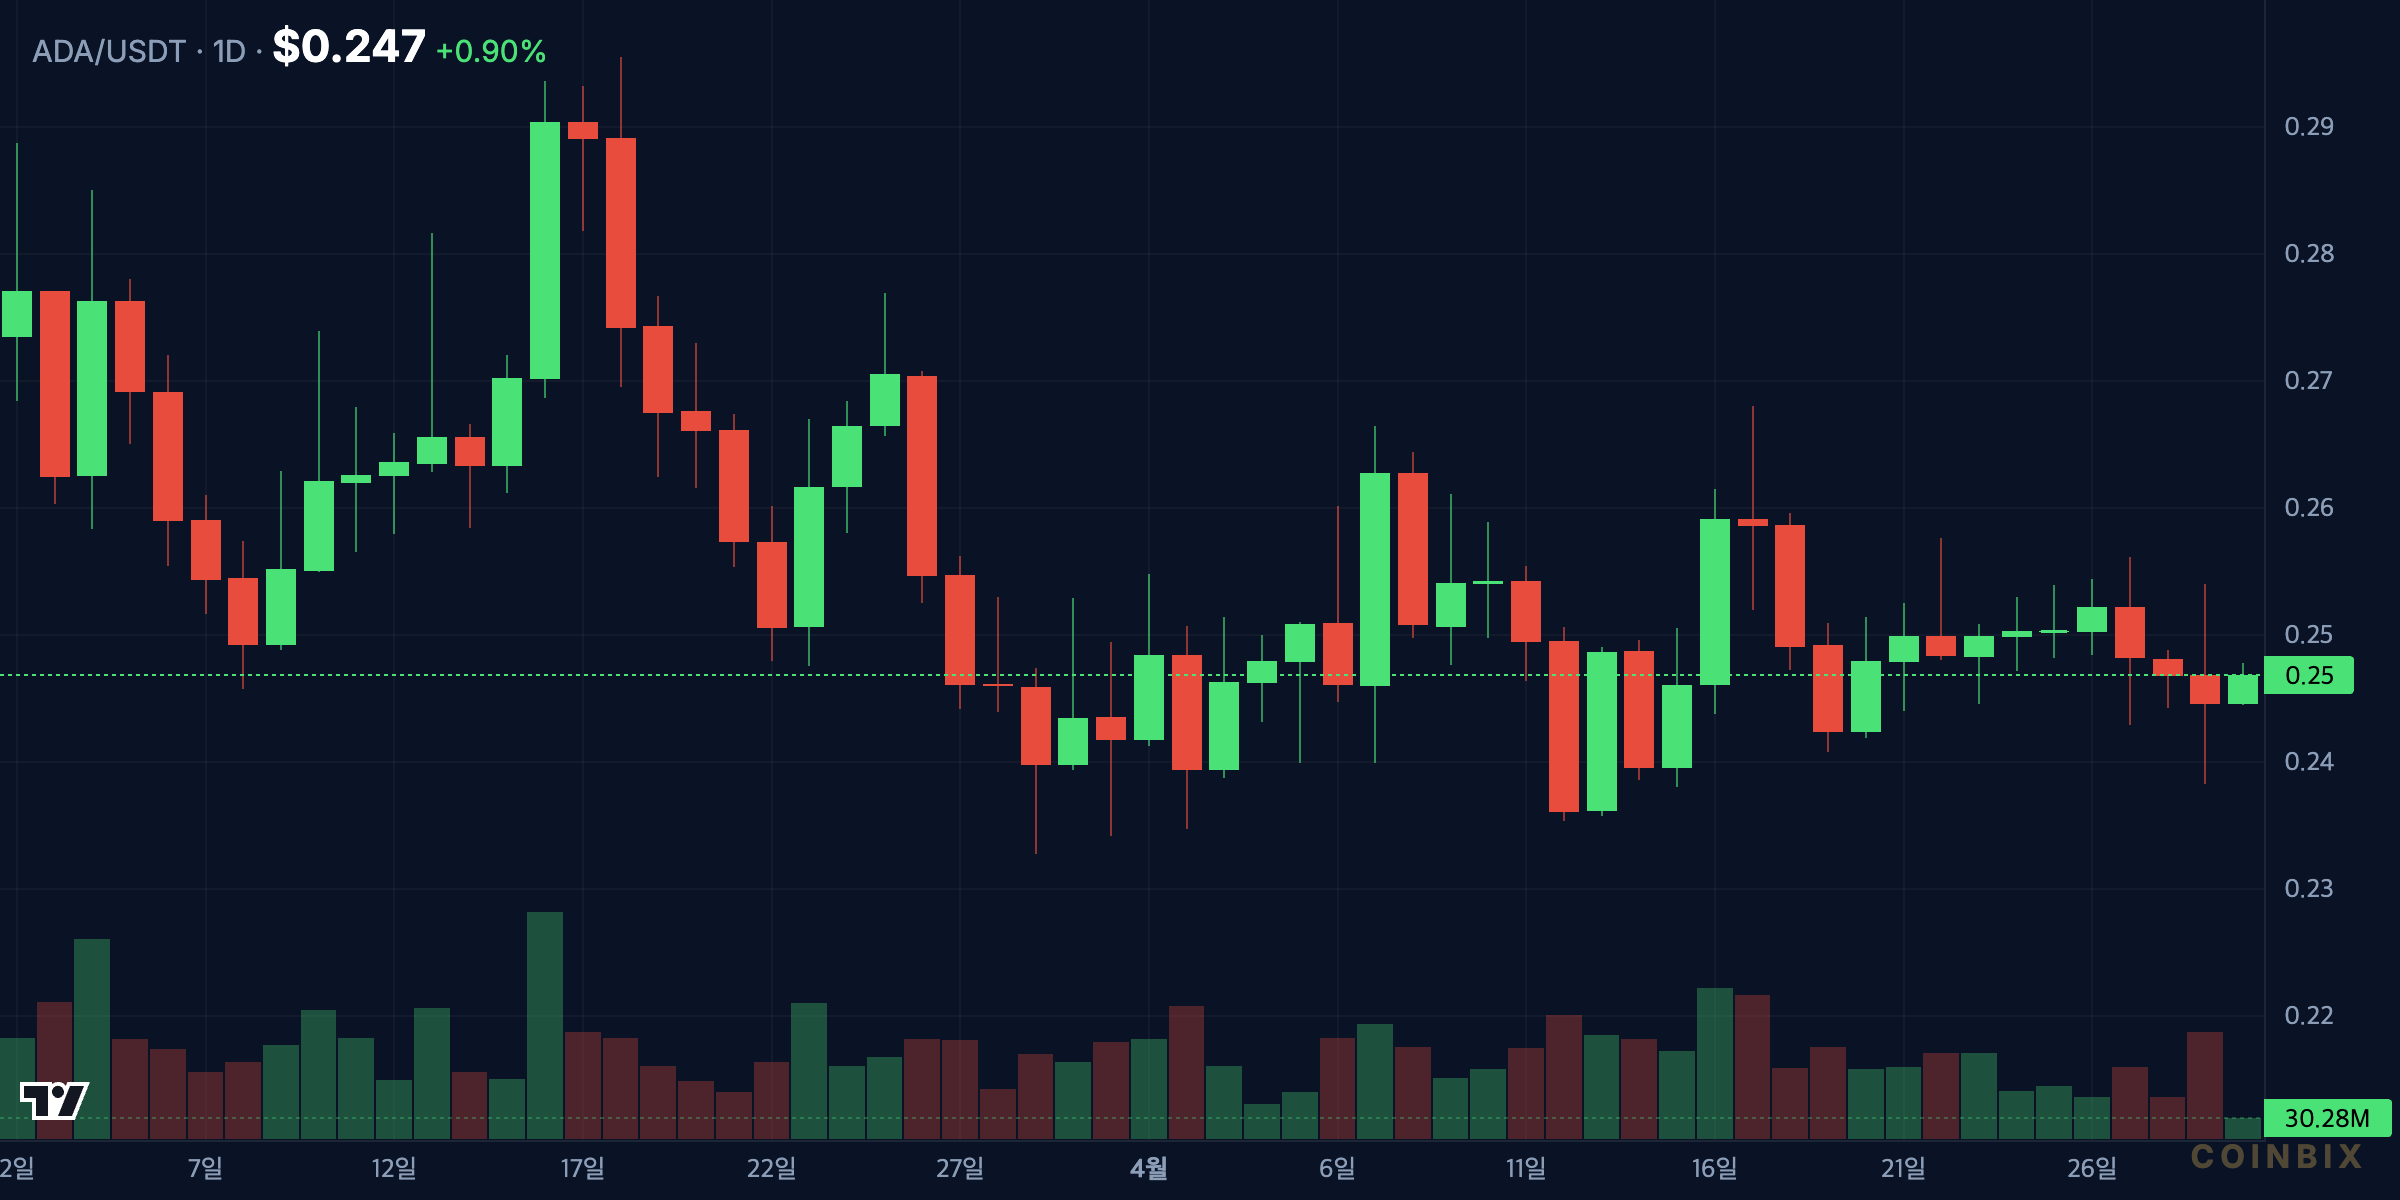
The daily chart remains the main obstacle for the $0.50 thesis. ADA is below the 20-day EMA near $0.2490, 50-day EMA near $0.2567, 100-day EMA near $0.2900, and 200-day EMA near $0.3844. That alignment is still bearish because faster averages are below slower averages and price is below the entire stack. For trend-following desks, this means ADA has not yet transitioned from accumulation to markup.
Daily RSI near 47.4 is neutral, not oversold. That matters because buyers do not have the classic deep-oversold spring setup anymore; instead, they need trend evidence. MACD is slightly negative, but the histogram is marginally positive, suggesting downside momentum is fading. The first constructive sign would be a daily close above the 20-day and 50-day EMAs, followed by a higher low above $0.248-$0.250.
The more important resistance levels are $0.2679, $0.2954, and $0.3136. The first marks the recent 20-day high area. The second marks the 50-day high and aligns with the breakdown ceiling from March-April. The third is the highest weekly level from the recent 20-week range. If ADA cannot reclaim $0.295-$0.314, the $0.50 conversation remains premature.
Support remains layered at $0.2354, $0.2328, and $0.2206. These levels are not arbitrary: they are recent daily and weekly lows where liquidity has already traded. A daily close below $0.2206 would invalidate the base-building view and suggest ADA is searching for a lower value area before a larger recovery can begin.
Weekly Structure: What Would Confirm a Move Toward $0.50?
The weekly chart shows why bulls are interested but also why confirmation is still missing. ADA’s weekly close near $0.247 is far below the 20-week EMA near $0.3154, the 50-week EMA near $0.4539, and the 100-week EMA near $0.5163. In other words, the $0.50 area is not just a round number. It is close to the long-term EMA structure that would need to flip from resistance into support.
Weekly RSI near 32.5 is weak, though no longer at panic levels. MACD remains negative, but the histogram is improving at roughly +0.0115. That is the strongest bullish technical detail in the dataset: downside momentum is easing on the higher timeframe. Still, improving bearish momentum is different from a confirmed bull trend. Price must follow.
The decisive weekly resistance band begins around $0.315 and extends toward $0.384, where the 20-week EMA and 200-day EMA overlap as a larger supply region. Above that, $0.4375-$0.4840 is the next weekly shelf, followed by the 50-week and 100-week EMAs near $0.454-$0.516. A clean weekly close above that zone would make $0.50 a confirmed breakout area rather than a distant recovery target.
The weekly support map is equally clear. ADA has held above the $0.2206 low from the last 100 daily candles and the last 20 weekly bars. If that low fails, the market would likely reprice toward a deeper accumulation range before attempting any sustained recovery. If it holds while price builds higher weekly lows, ADA can begin to form the base required for a multi-month advance.
Cardano Fundamentals: Is the Ecosystem Helping Price?
Cardano’s fundamental narrative remains active, but price has not yet rewarded it. The network’s core identity is still a research-led proof-of-stake blockchain with smart contracts, staking, and governance participation. The official Cardano documentation describes ADA as the asset used for transfers, fees, staking, and governance, while smart-contract functionality is built around Plutus and the extended UTXO model.
Hydra is the scaling theme many ADA holders watch. The Hydra Head protocol documentation frames Hydra heads as a way for participants to process activity off the main chain before settling back to Cardano. For traders, the important point is not that Hydra exists, but whether usage, developer activity, and application demand translate into higher fee activity and stronger market attention.
Therefore, the ecosystem helps the bullish case at the margin, but the chart still controls timing. A technically weak asset can have credible development progress and still underperform if capital is rotating elsewhere. For ADA, the bridge between fundamentals and price is likely to appear first through volume expansion, relative strength versus other layer-1 assets, and a reclaim of the long-term EMA stack.
Scenario Map: Bullish, Neutral, and Bearish Paths
Bullish scenario: ADA holds $0.238-$0.220, reclaims $0.257, and closes above $0.295-$0.314 on rising daily volume. That would shift the market from range defense to trend repair. The next target would be $0.384, where the 200-day EMA sits, followed by $0.437-$0.484. A weekly close above $0.516 would confirm that $0.50 has become support rather than resistance.
Neutral scenario: ADA oscillates between $0.238 and $0.276 while daily RSI stays near 50 and volume remains below trend. Traders would watch for a higher low near $0.245-$0.250 and a later breakout through $0.276-$0.295.
Bearish scenario: ADA loses $0.238 and then closes below $0.2206. That would break the visible base and weaken the idea that buyers are absorbing supply. The next phase would likely be a search for lower support, with $0.20 becoming the psychological level to monitor. Under this path, $0.50 would be deferred until ADA rebuilds structure from a lower range.
For the large-cycle $10 discussion, the hurdle is much higher. At current circulating supply, $10 implies a market cap near $370 billion. That is not impossible in a future crypto supercycle, but it requires broad market expansion, sustained ecosystem adoption, institutional capital, and a multi-year trend. Today’s chart supports discussing $0.50 as a recovery objective; it does not yet validate $10 as an active technical target.
Conclusion: ADA Needs Proof Before the $0.50 Breakout
ADA has a defendable base, improving weekly momentum, and a clean upside map. That makes the $0.50 target worth tracking. But the current evidence is still conditional. Price remains below the daily and weekly EMA stack, volume confirmation is thin, and the strongest resistance levels sit between $0.295 and $0.516. Until ADA clears those zones, the market is still in repair mode rather than expansion mode.
The best trader’s read is disciplined optimism. Above $0.257, ADA can begin to challenge $0.276 and $0.295. Above $0.314, the recovery case becomes more serious. Above $0.384, the market can start pricing a run toward $0.45-$0.50. Below $0.2206, the bullish structure fails. That level-by-level framework is more useful than anchoring to a single headline target.
Bybit 20% Fee Discount
Free Coinbix Premium Channel
FAQ
What is the key ADA support level now?
The key support zone is $0.238-$0.2206. ADA has held this area across recent daily and weekly candles. A daily close below $0.2206 would weaken the base and delay the recovery setup.
What price confirms ADA strength?
The first confirmation is a daily close above $0.257-$0.276. A stronger confirmation comes above $0.295-$0.314, where ADA would reclaim a major short-term resistance band and challenge the 20-week EMA area.
Can Cardano reach $0.50 again?
Yes, but the path requires confirmation. ADA needs to reclaim the 200-day EMA near $0.384, then push through the weekly supply band around $0.437-$0.516. Without volume expansion, $0.50 remains a target rather than a confirmed trend.
Why is Cardano’s weekly MACD important?
Weekly MACD remains negative, but its histogram is improving. That suggests bearish momentum is fading. It is an early constructive signal, but price must confirm it with higher weekly closes above resistance.
Does Cardano’s ecosystem support the bullish case?
Cardano’s Hydra scaling work, governance upgrades, staking model, and smart-contract platform support the long-term narrative. For price, however, traders still need evidence through volume, relative strength, and reclaimed moving averages.
Affiliate Disclosure: This page contains affiliate links. Coinbix may earn a commission at no extra cost to you.
Disclaimer: This article is for informational purposes only and does not constitute financial advice. Cryptocurrency investments carry significant risk. Always conduct your own research before making investment decisions.