Key Takeaways
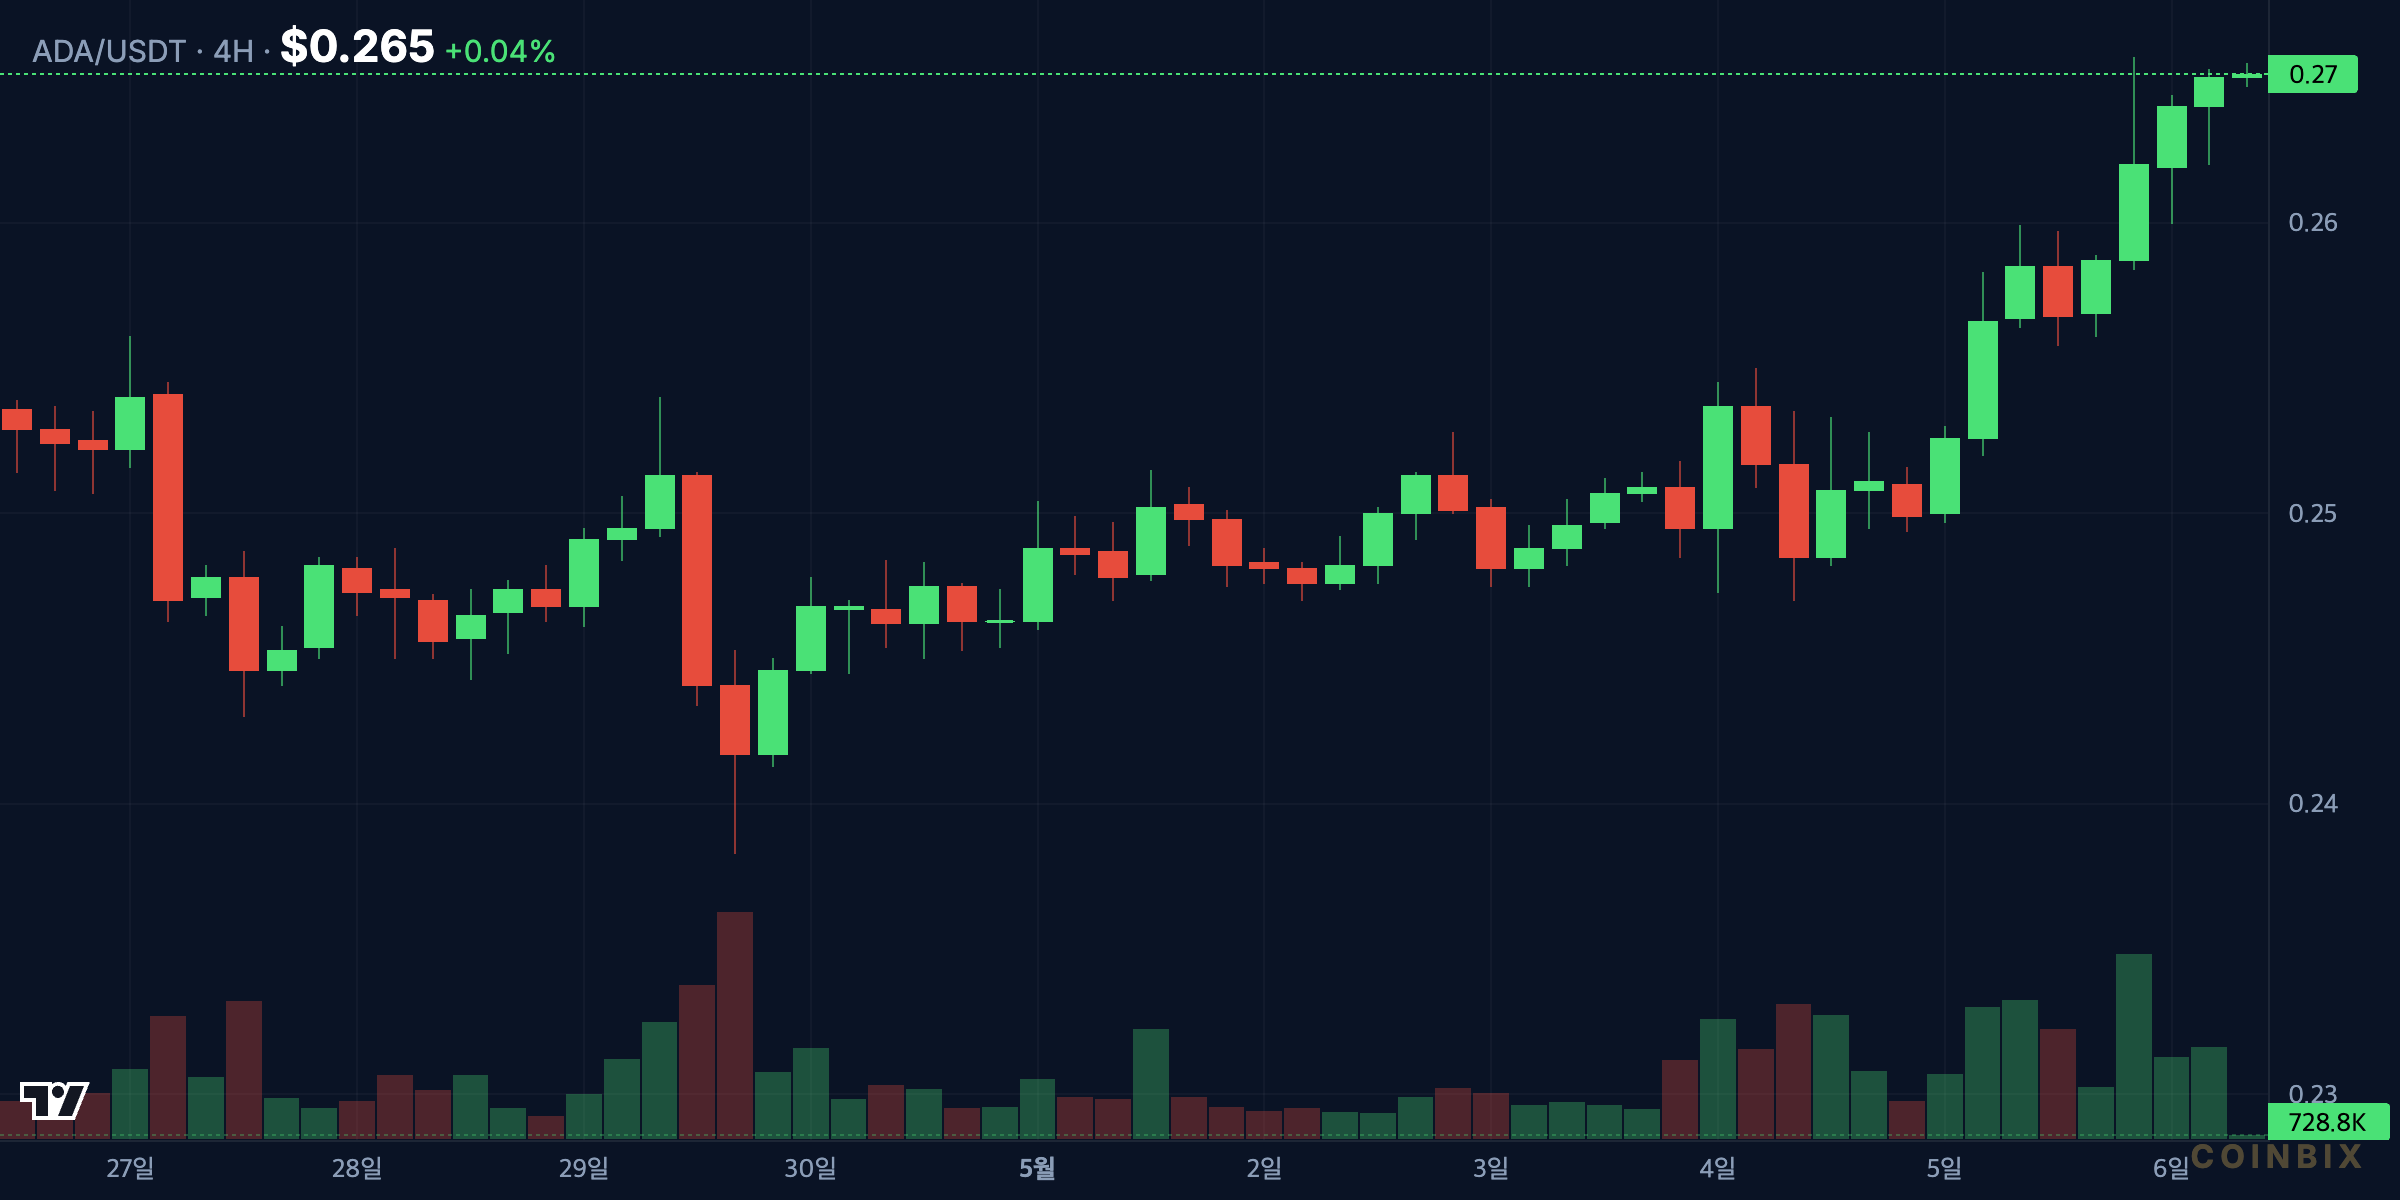
- ▲ ADA broke above its two-week consolidation range after the May 3 candle reached $0.2657, shifting short-term momentum toward buyers.
- ■ The $0.2600-$0.2620 area is now the first level to defend; a daily close below it would weaken the breakout structure.
- ▼ Volume confirmation is still incomplete because May 4 participation is partial, leaving the move vulnerable to a failed-breakout pullback.
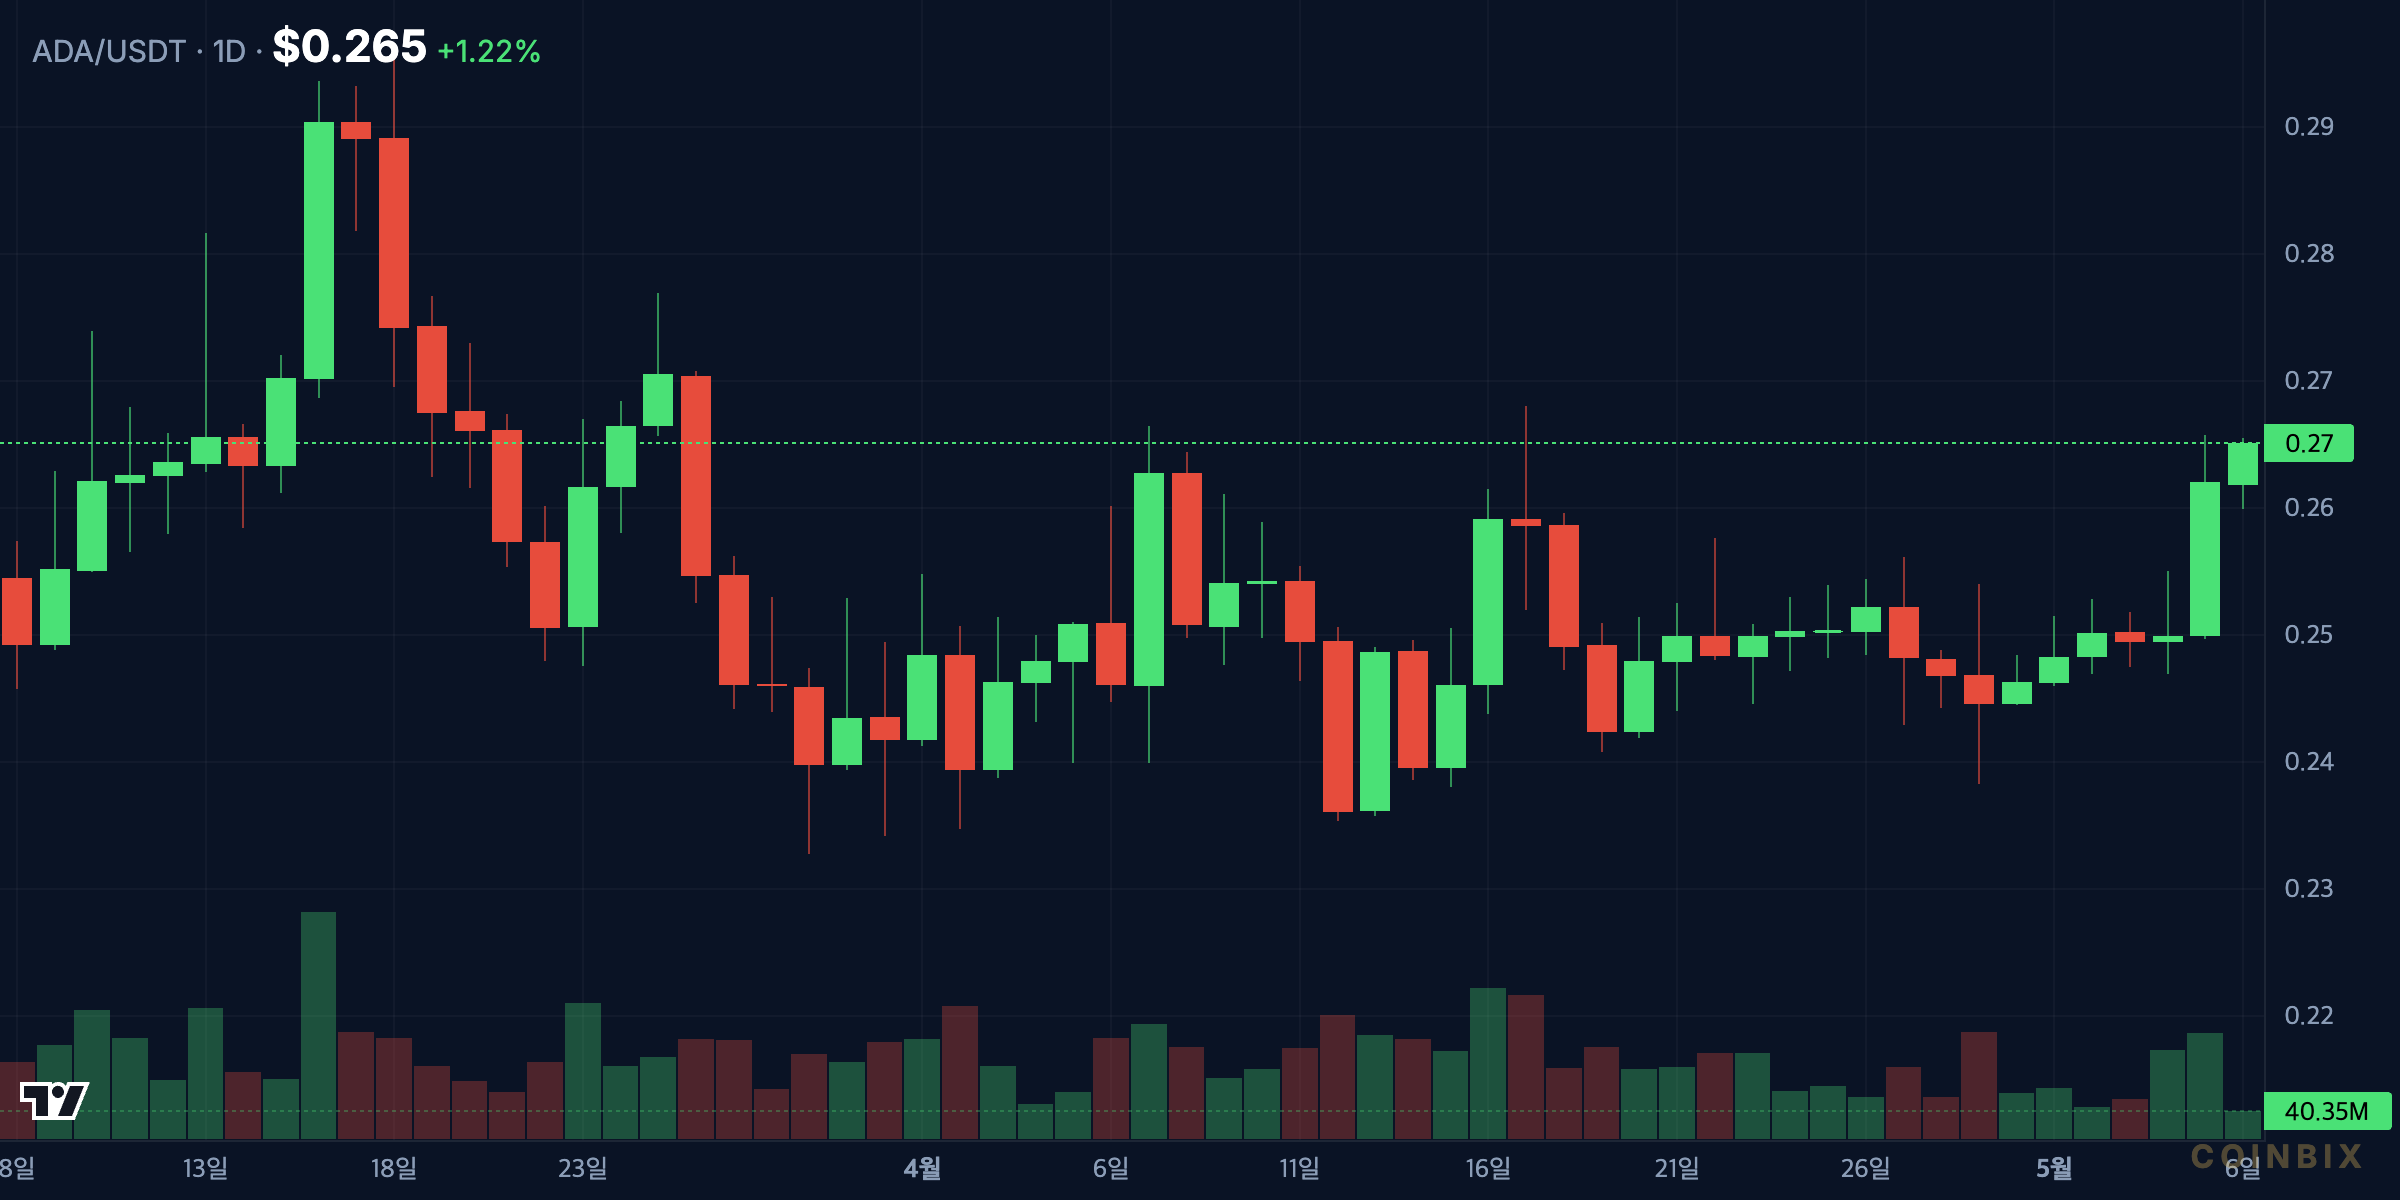
Cardano is showing one of its cleaner short-term reversal attempts in recent weeks. ADA is trading near $0.2649, up 3.15% over 24 hours and 6.57% over seven days, according to market data from CoinGecko. The immediate technical story is not simply that price moved higher. It is that ADA finally pushed above a narrow daily range that had capped rallies near $0.2520-$0.2560 for most of the prior two weeks.
The May 3 daily candle is the key event. ADA opened at $0.2500, traded as high as $0.2657, and closed at $0.2620 on 44.1 million ADA in ADAUSDT spot volume. That close changed the chart from a slow compression pattern into an active breakout test. The current partial May 4 candle has extended the move to $0.2648, holding above $0.2600 so far. If buyers can keep ADA above the breakout band, the next phase becomes a test of whether momentum can expand toward $0.2700-$0.2750.
Why Cardano’s Breakout Matters Now
ADA spent the April 21-May 2 period moving in a compressed range. Daily closes clustered between $0.2445 and $0.2521, while intraday highs repeatedly stalled below the $0.2560 level. This kind of structure often reflects a market waiting for a trigger: sellers are no longer able to push the asset materially lower, but buyers still need a decisive close above supply to prove control.
The May 3 move provided that first proof. The candle cleared the previous local high at $0.2560 from April 25 and closed above $0.2600. In technical terms, that matters because ADA moved through both horizontal resistance and psychological round-number supply in the same session. A single candle does not confirm a new trend by itself, but it does identify where market participants are likely to reprice risk.
There is also a sequencing point. The largest volume day in the sample was May 2, when ADA recorded 62.8 million in volume but closed almost flat at $0.2500 after trading between $0.2472 and $0.2552. That session looked like absorption: heavy participation without a decisive breakdown. The next session then delivered the breakout. When a high-volume balance day is followed by range expansion, it often signals that liquidity was collected before the next directional move.
What Levels Define ADA’s Next Move?
The first resistance is the May 3 high at $0.2657. ADA is currently trading just below that area, which means buyers have not yet created meaningful distance from the breakout candle. A daily close above $0.2660 would reduce the risk that the move is merely a wick-driven stop run and would put the next resistance band near $0.2700-$0.2750 in focus.
The $0.2700 level matters because it is the next round-number magnet after the breakout. The $0.2750 area is more important from a market-structure perspective because it would represent a wider extension from the April consolidation base. If ADA can reach that zone while volume remains above the late-April baseline, the chart would begin to resemble a stronger reversal rather than a brief relief bounce.
On the downside, the first support is $0.2600-$0.2620. This is the breakout acceptance zone, anchored by the May 3 close at $0.2620 and the current May 4 low at $0.2600. Holding this band would show that former resistance is beginning to act as support. Losing it would not automatically destroy the broader setup, but it would move ADA back into a retest phase.
The deeper support band sits at $0.2480-$0.2520. This range captured several closes from April 21 through May 2, including $0.2498, $0.2504, $0.2502, $0.2521, $0.2482, $0.2502, $0.2495, and $0.2500. If ADA revisits this area after a failed breakout, bulls would need to defend it aggressively to avoid a return toward the April 27 low at $0.2384.
Volume Confirms Interest, But Not Yet Full Conviction
Volume is the strongest supporting evidence for the bullish case, but it also deserves nuance. The late-April baseline was light: Apr 28 volume was 16.1 million, Apr 29 was 19.3 million, Apr 30 was 12.5 million, and May 1 was 13.0 million. Against that backdrop, May 2 volume of 62.8 million and May 3 volume of 44.1 million marked a clear participation surge.
That two-day expansion suggests ADA attracted new positioning rather than drifting higher on thin liquidity. The combined May 2-May 3 volume of 106.9 million was larger than the combined volume of the previous four sessions. This matters because breakouts from quiet ranges are more reliable when participation expands as price leaves the range.
However, the May 4 candle is partial, with only 5.6 million in volume in the provided data. That means the market has not yet delivered a full-session confirmation above $0.2600. A low-volume hold can be constructive if it shows supply is not returning, but the stronger signal would be another high-volume close above $0.2660. Without that, ADA remains in the first stage of breakout validation.
 Bybit 20% Fee Discount
Free Coinbix Premium Channel
How Does ADA Look Against Its Broader Market Context?
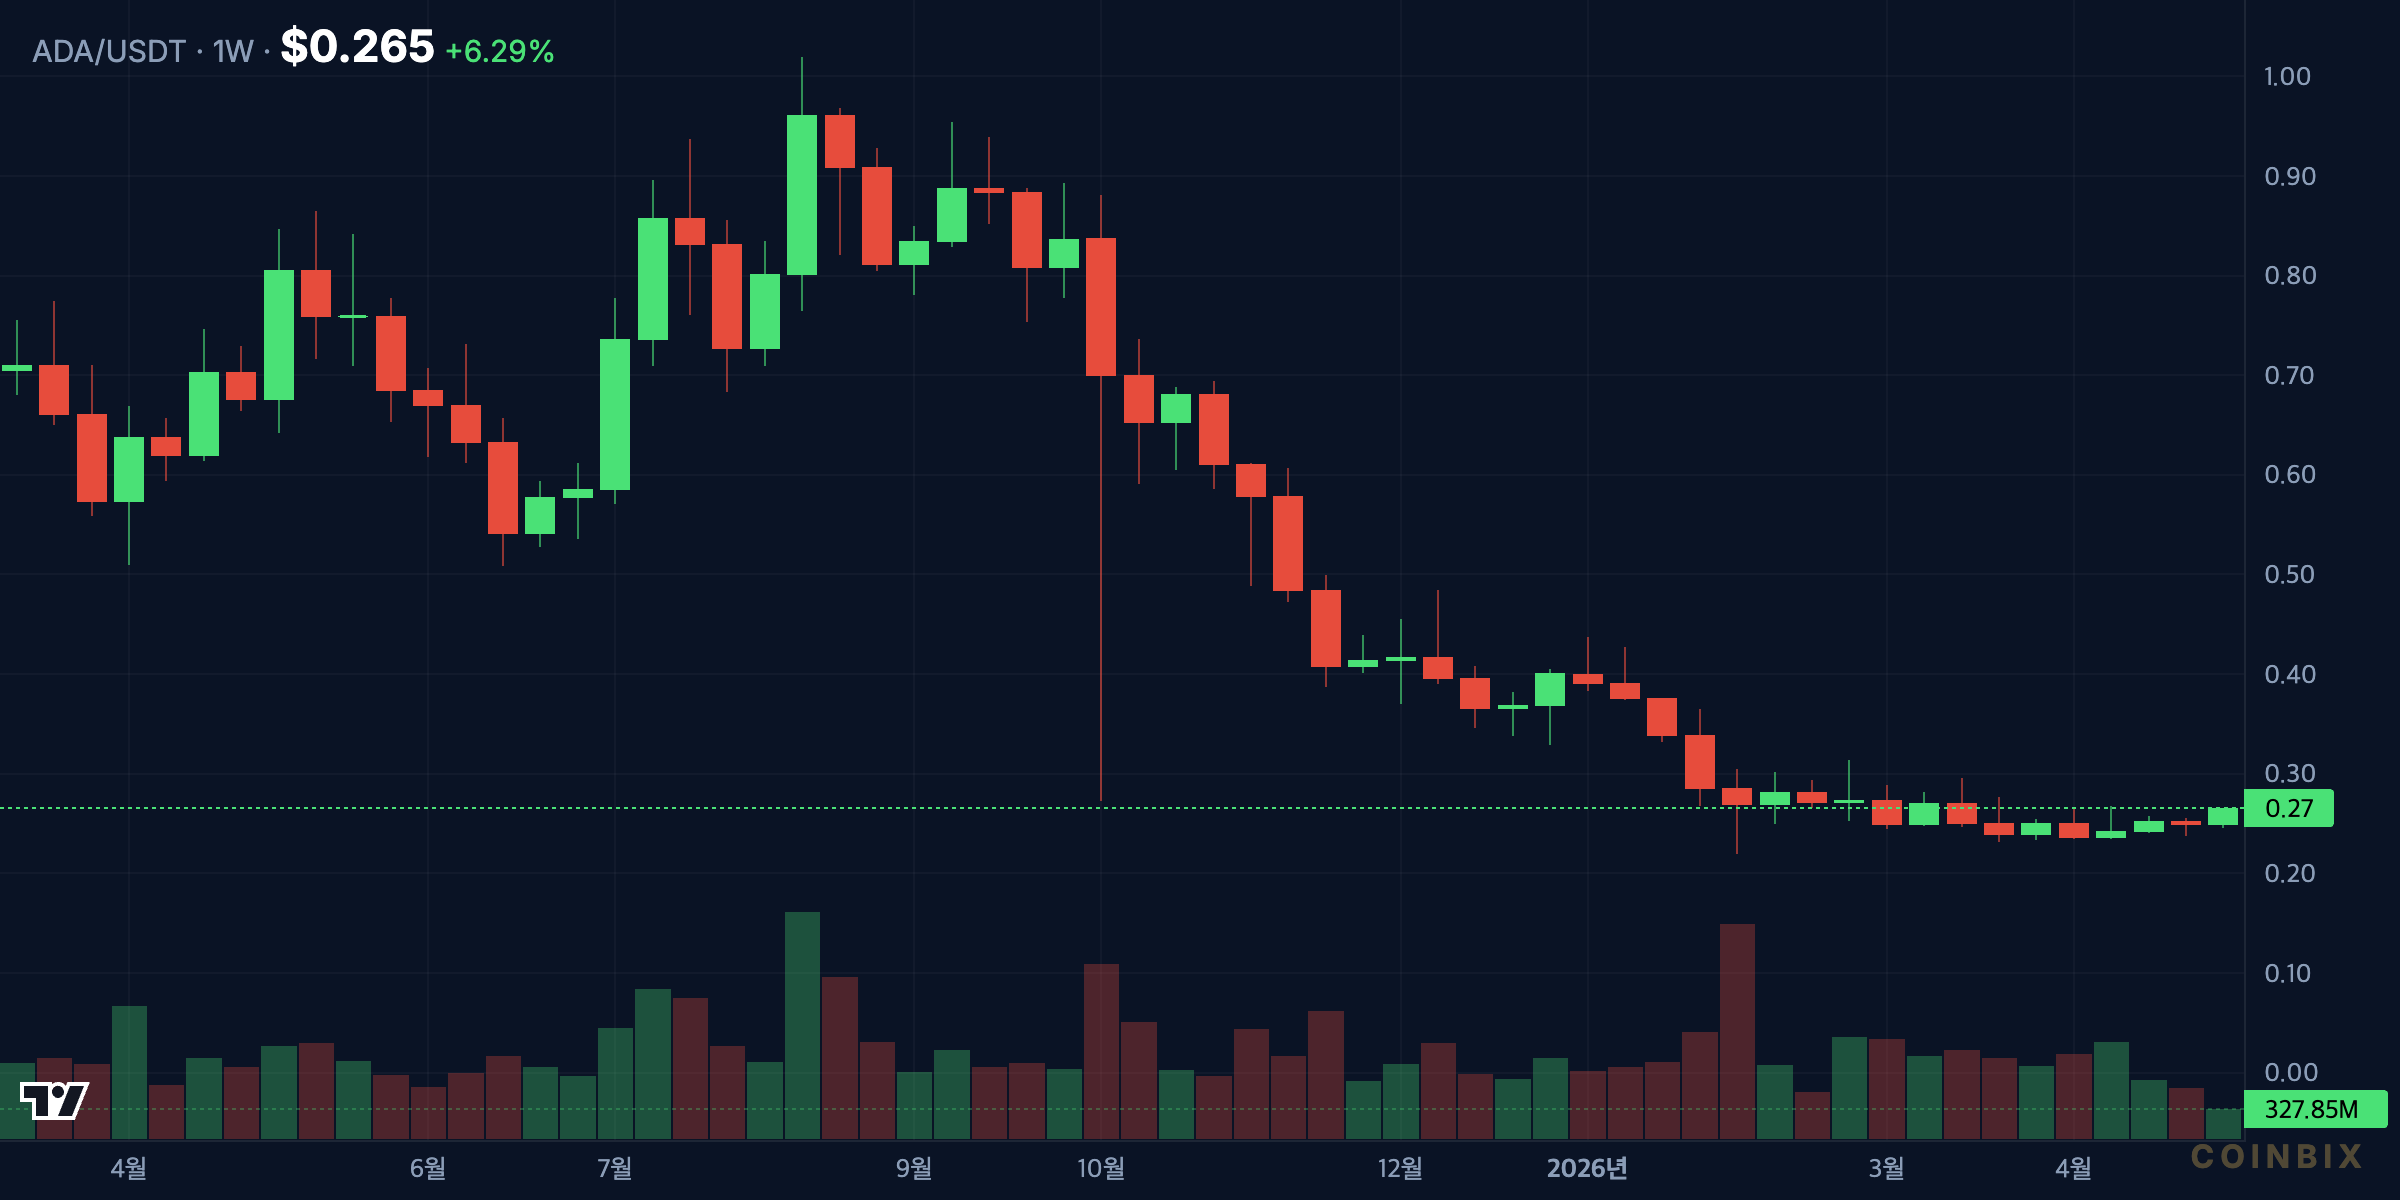
Cardano’s market profile remains large, liquid, and deeply discounted from its prior cycle peak. ADA has a market capitalization near $9.8 billion, a fully diluted valuation near $11.9 billion, and circulating supply of 36.98 billion ADA out of a 45 billion maximum supply. The token remains about 91.4% below its September 2021 all-time high of $3.09, which helps explain why even modest technical improvements can attract attention from swing participants.
That distance from the all-time high is a double-edged signal. On one hand, it means ADA has not yet reclaimed the kind of momentum that defined the previous bull cycle. On the other hand, the current price base near $0.25 gives the market a cleaner risk-reward map: short-term invalidation levels are close, while upside resistance zones can be measured clearly.
The Cardano ecosystem also gives the chart a fundamental backdrop beyond price alone. Cardano positions itself as a proof-of-stake blockchain focused on research-driven development, smart contracts, and scalable infrastructure, with official resources maintained through the Cardano developer portal. For market analysis, the key point is not to assume that ecosystem activity automatically drives price. Instead, it is to understand why ADA continues to maintain institutional attention despite long consolidation periods.
In this phase, the narrative is about whether Cardano can convert a large, established holder base into renewed risk appetite. Ecosystem upgrades, decentralized application activity, staking participation, and developer engagement can all influence sentiment. But price still needs confirmation through liquidity and higher highs. The chart is currently giving the first signal; broader conviction requires follow-through.
Can ADA Build a Higher-Timeframe Reversal?
The higher-timeframe question is whether the move above $0.2600 can become the start of a larger reversal structure. The daily chart has improved because price has broken a two-week ceiling. The weekly view, however, still requires more work. ADA remains far below its cycle high and has not yet produced evidence of a sustained macro uptrend from the supplied price data.
For a more durable reversal, ADA would ideally need three developments. First, it should hold above $0.2600 during short-term pullbacks. Second, it should print a higher close above $0.2660 and then challenge $0.2750. Third, volume should remain elevated relative to the late-April baseline rather than returning immediately to the 12 million-20 million range.
If those conditions appear together, the market can start treating the April 27 low at $0.2384 as a local higher-low reference. That would give ADA a cleaner trend framework: a defended low near $0.2384, a consolidation base around $0.2500, and a breakout extension above $0.2600. This is the type of sequence technicians look for when a market shifts from accumulation to early markup.
Bull Case: ADA Holds $0.2600 and Extends Toward $0.2750
The bullish scenario is straightforward. ADA holds the $0.2600-$0.2620 breakout zone, consolidates above it, and then closes above the May 3 high at $0.2657. A move through that level would likely draw attention to $0.2700 first and $0.2750 after that. If participation expands again during the push, the market could begin to price ADA as a short-term momentum candidate rather than a lagging large-cap altcoin.
The strongest version of this scenario would include shallow pullbacks. If ADA dips toward $0.2620 but quickly rebounds, it would show that buyers are defending the former resistance zone. That would be more constructive than a vertical move with no retest, because confirmed support often creates a more stable base for continuation.
Bear Case: Failed Breakout Sends ADA Back to Range
The bearish scenario begins with a daily close back below $0.2600. That would suggest the May 3 breakout failed to gain acceptance. If price then loses $0.2520, ADA would be back inside the old range, and the market could test whether demand remains near $0.2480-$0.2500. A deeper loss of that band would reopen the path toward $0.2440 and potentially the April 27 low at $0.2384.
The key warning sign would be rising volume on a pullback. Low-volume consolidation after a breakout can be healthy. High-volume rejection below $0.2600 would be different because it would show sellers actively using the breakout area as liquidity. That would turn the chart from constructive to neutral, and possibly bearish if $0.2480 fails.
Neutral Scenario: ADA Consolidates Above the Breakout Band
A third scenario may be the most realistic in the immediate term. ADA could spend several sessions between $0.2600 and $0.2660 while the market digests the May 3 move. This would not be a failure as long as the range stays above the prior ceiling. For large-cap crypto assets, constructive pauses often matter because they allow leverage and short-term positioning to reset before the next directional attempt.
In that environment, analysts should watch closing prices more than intraday wicks. A wick below $0.2600 followed by a close back above $0.2620 would show demand. A close below $0.2600 would shift attention toward $0.2520. Conversely, a close above $0.2660 would signal that the next expansion phase may already be starting.
Bybit 20% Fee Discount
Free Coinbix Premium Channel
Conclusion: ADA Has a Bullish Setup, Not a Confirmed Trend
Cardano’s short-term chart has improved meaningfully. The May 3 breakout above the $0.2560 ceiling, the close at $0.2620, and the two-day volume surge on May 2-May 3 all support the case for upside continuation. Current price near $0.2649 keeps ADA close to the breakout high, which means the next few daily closes are especially important.
The cleanest bullish trigger is a daily close above $0.2660, followed by a push toward $0.2700-$0.2750. The cleanest invalidation signal is a daily close back below $0.2600, especially if accompanied by heavier selling volume. Until one of those signals arrives, ADA is best described as an early breakout candidate with improving momentum but incomplete confirmation.
FAQ
What is the key resistance for Cardano now?
The first key resistance is $0.2657-$0.2660, based on the May 3 breakout high. A daily close above that area would strengthen the bullish case.
What support level matters most for ADA?
The $0.2600-$0.2620 zone matters most in the short term because it marks the breakout acceptance area. Holding it keeps the structure constructive.
Was ADA volume strong during the breakout?
Yes. ADA recorded 62.8 million in volume on May 2 and 44.1 million on May 3, well above the late-April baseline of roughly 12 million-20 million.
Could Cardano return to its old range?
Yes. A daily close below $0.2600 would weaken the breakout, and a move below $0.2520 would put ADA back inside its prior consolidation range.
What would confirm a stronger ADA reversal?
A stronger reversal would require ADA to hold above $0.2600, close above $0.2660, challenge $0.2750, and sustain higher volume than the late-April baseline.
Affiliate Disclosure: This page contains affiliate links. Coinbix may earn a commission at no extra cost to you.
Disclaimer: This article is for informational purposes only and does not constitute financial advice. Cryptocurrency investments carry significant risk. Always conduct your own research before making investment decisions.