Key Takeaways
- ▼ XRP lost the $1.40 pivot after a heavy-volume drop from $1.4109 to $1.3987, with sellers extending the move to $1.3865.
- ▲ The market stabilized above $1.38, keeping a short-term breakout setup alive if XRP can reclaim $1.41-$1.42 with volume.
- ■ The current range is tightening between $1.38 support and $1.41 resistance, so confirmation matters more than prediction.
XRP is entering a decisive compression phase after slipping below the $1.40 level on unusually heavy volume. According to CoinDesk market coverage, XRP fell from $1.4109 to $1.3987 as volume surged to 103 million tokens, then extended lower to $1.3865 before stabilizing in a narrow $1.3925-$1.4015 band. That sequence matters because $1.40 has shifted from a short-term support area into a live resistance pivot.
This XRP breakout analysis focuses less on a single intraday breach and more on the market structure now forming around it. Heavy volume on the move lower, fading volume during consolidation, and repeated failure to hold above $1.40 all point to a market waiting for confirmation. The next directional move will likely depend on whether buyers defend $1.38 or sellers force a continuation toward $1.34 and $1.30.
Why the $1.40 Pivot Matters Now
The $1.40 area is important because markets often retest broken support as resistance. XRP’s latest move created exactly that setup. Price slipped below $1.40, bounced back toward the level late in the session, briefly reclaimed it, and then failed to hold. That failure turns the level into a short-term decision point rather than a simple round number.
On a daily chart, the key question is whether the breakdown below $1.40 represents distribution or a false move inside a broader range. A clean daily close back above $1.41 would weaken the bearish case because it would show that sellers could not maintain control after the volume spike. By contrast, repeated closes below $1.40 would confirm that overhead supply has increased and that buyers are becoming more selective.
Volume is the strongest signal in this setup. The 103 million token spike came during the drop, not during the rebound. That tells analysts the most aggressive participation occurred on the downside. During the later consolidation, activity faded, which is typical when the market pauses after a fast repricing. It does not prove that another leg lower is coming, but it does mean the next expansion should be judged by whether volume returns with price.
What Does XRP Compression Signal?
XRP compression signals that volatility is contracting between well-defined levels. In this case, the lower boundary sits near $1.38, while the upper boundary sits near $1.41-$1.42. When price compresses after a high-volume move, the market is often absorbing the first wave of selling before deciding whether to reverse or continue.
The most constructive interpretation is that XRP absorbed selling near $1.3865 and avoided a deeper breakdown. Stabilization above $1.38 shows there is still demand around the lower end of the range. If buyers can build from that area and reclaim $1.40, the failed breakdown risk increases for shorts, especially if the move is accompanied by stronger spot and derivatives volume.
The more cautious interpretation is that XRP is forming a bear flag below former support. In that scenario, the tight range is not accumulation; it is a pause before another downside push. The warning sign would be continued inability to close above $1.40, followed by a decisive break of $1.38. If that happens, the $1.34 area becomes the first downside target, with $1.30 as the larger psychological level.
Momentum also reset sharply during the drop, which creates room for expansion once the range resolves. A momentum reset can be bullish if price holds support and buyers regain control, but it can also allow a fresh downside impulse if support fails. That is why the structure now favors conditional analysis: the levels are clear, but direction remains unresolved.
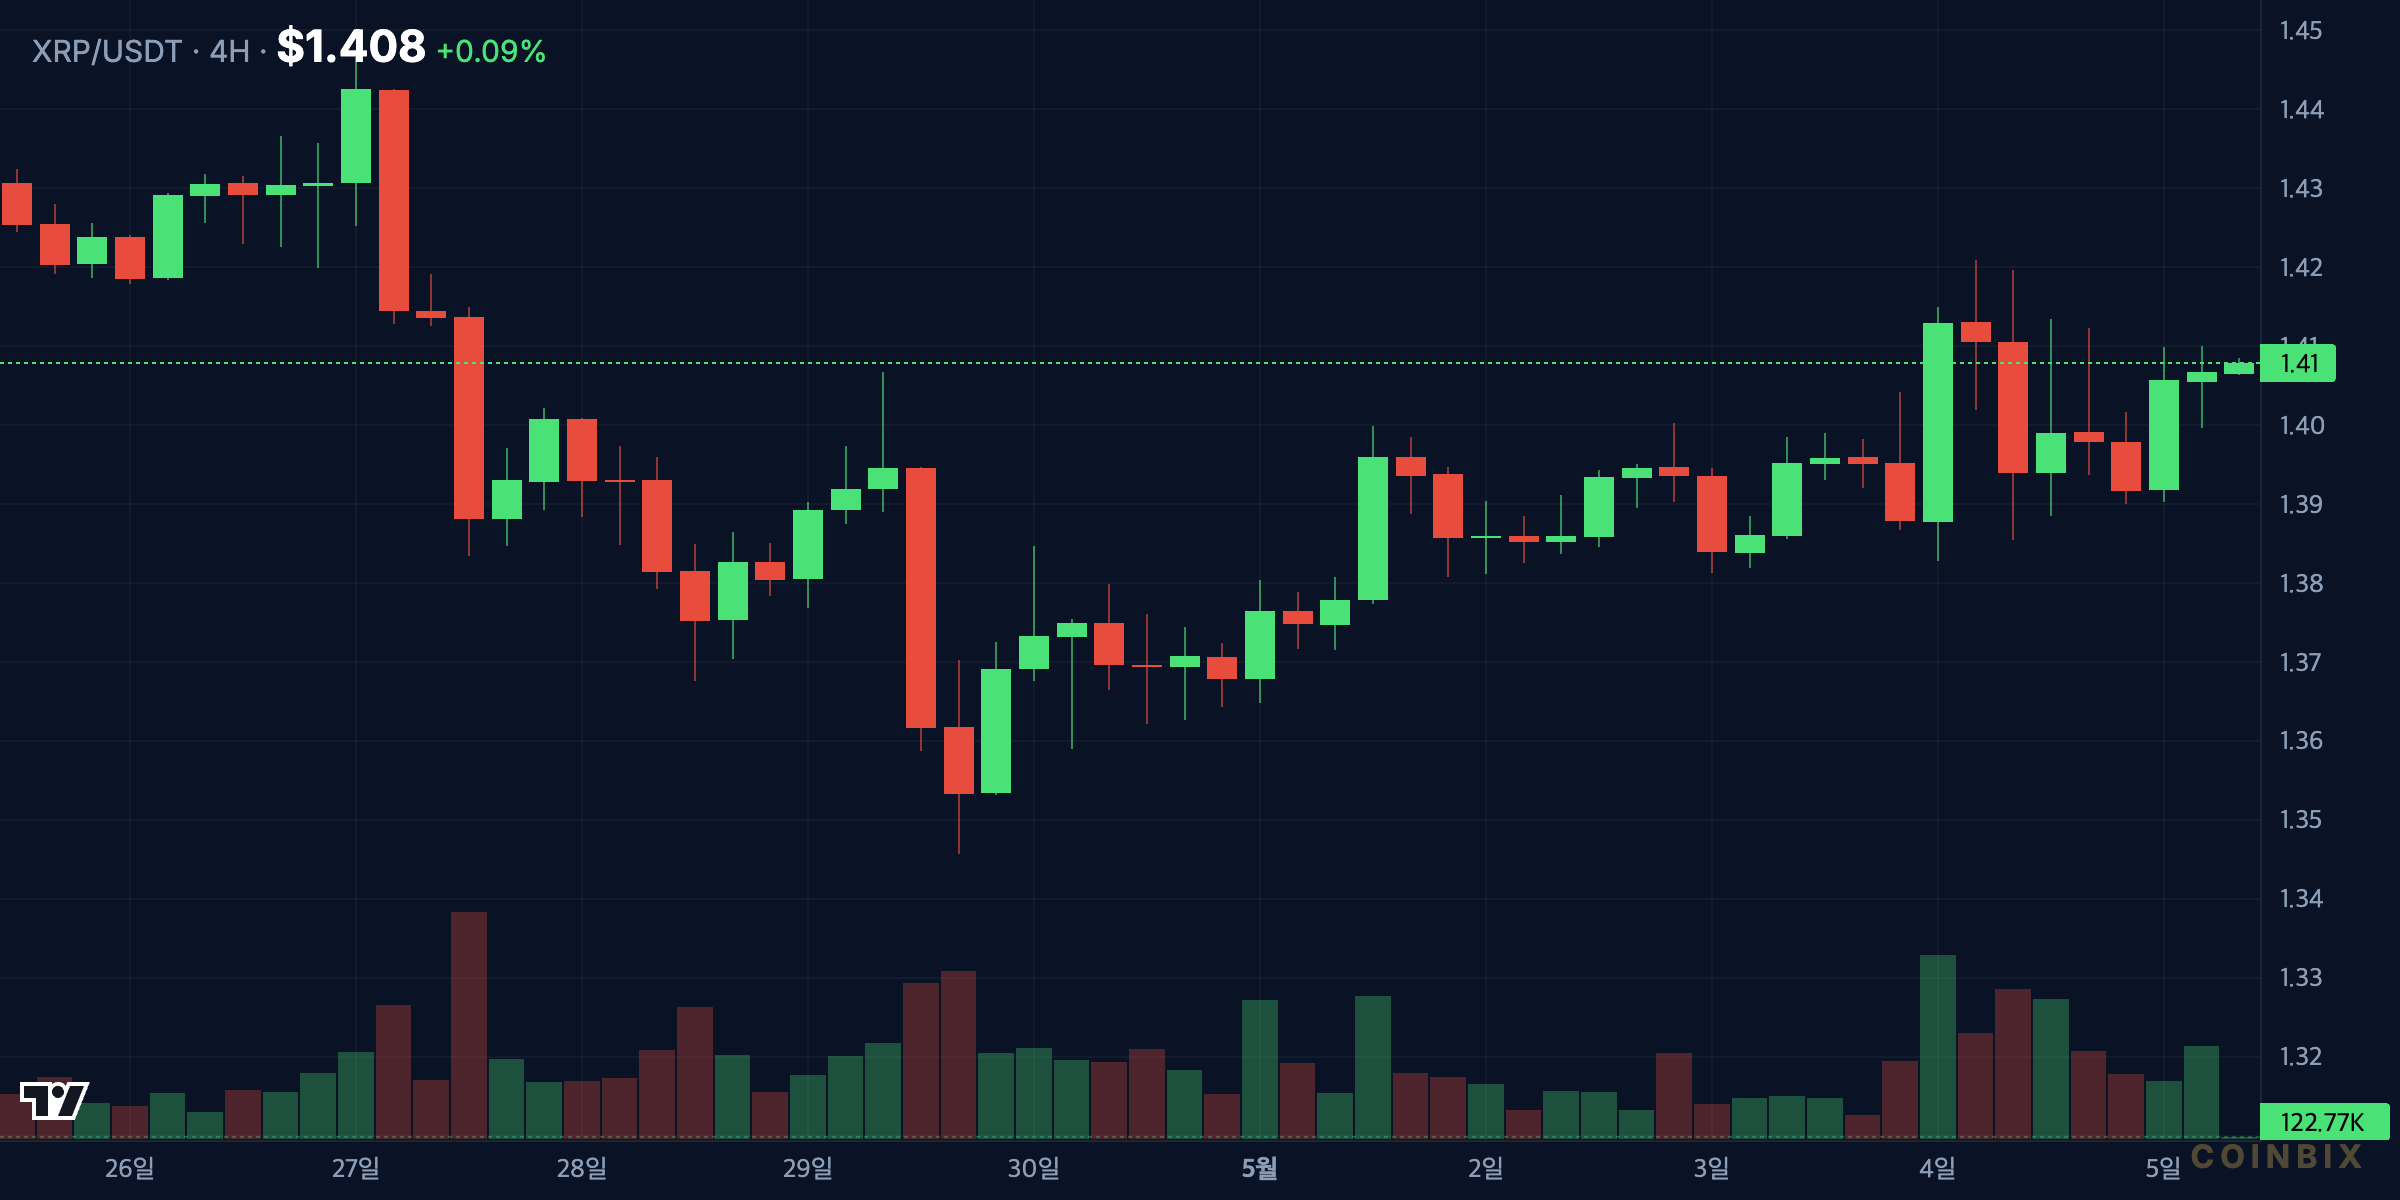
Four-Hour Pattern: Range Tightens After the Flush
The four-hour chart is likely to show the cleanest version of the current structure. The initial flush pushed XRP through $1.40, printed a low near $1.3865, and then moved into a narrower $1.3925-$1.4015 consolidation band. That kind of post-flush range often becomes the base for the next short-term signal.
For bulls, the first technical improvement would be a reclaim of $1.40 that holds for more than a brief intraday spike. A stronger signal would be a push through $1.41, followed by acceptance above $1.42. That would suggest the market has absorbed the lower-volume consolidation and is ready to challenge the upper range. If that move happens while volume expands, it would carry more weight than a thin liquidity bounce.
For bears, the priority is to keep XRP below $1.40 and force lower highs inside the compression zone. If each attempt to recover $1.40 is rejected faster, it would show sellers are defending the pivot. A break below $1.3865 would then put $1.38 under immediate pressure. Once $1.38 fails, stop orders and systematic momentum strategies may add to downside volatility.
The pattern is not yet a confirmed breakout or breakdown. It is a narrowing range after a downside volume event. That distinction matters. Acting too early inside the range can lead to whipsaw because the market has already shown it can briefly reclaim $1.40 without sustaining the move. Confirmation requires both price acceptance and volume follow-through.
 Bybit 20% Fee Discount
Free Coinbix Premium Channel
Daily Chart: Support, EMAs, and Closing Price Quality
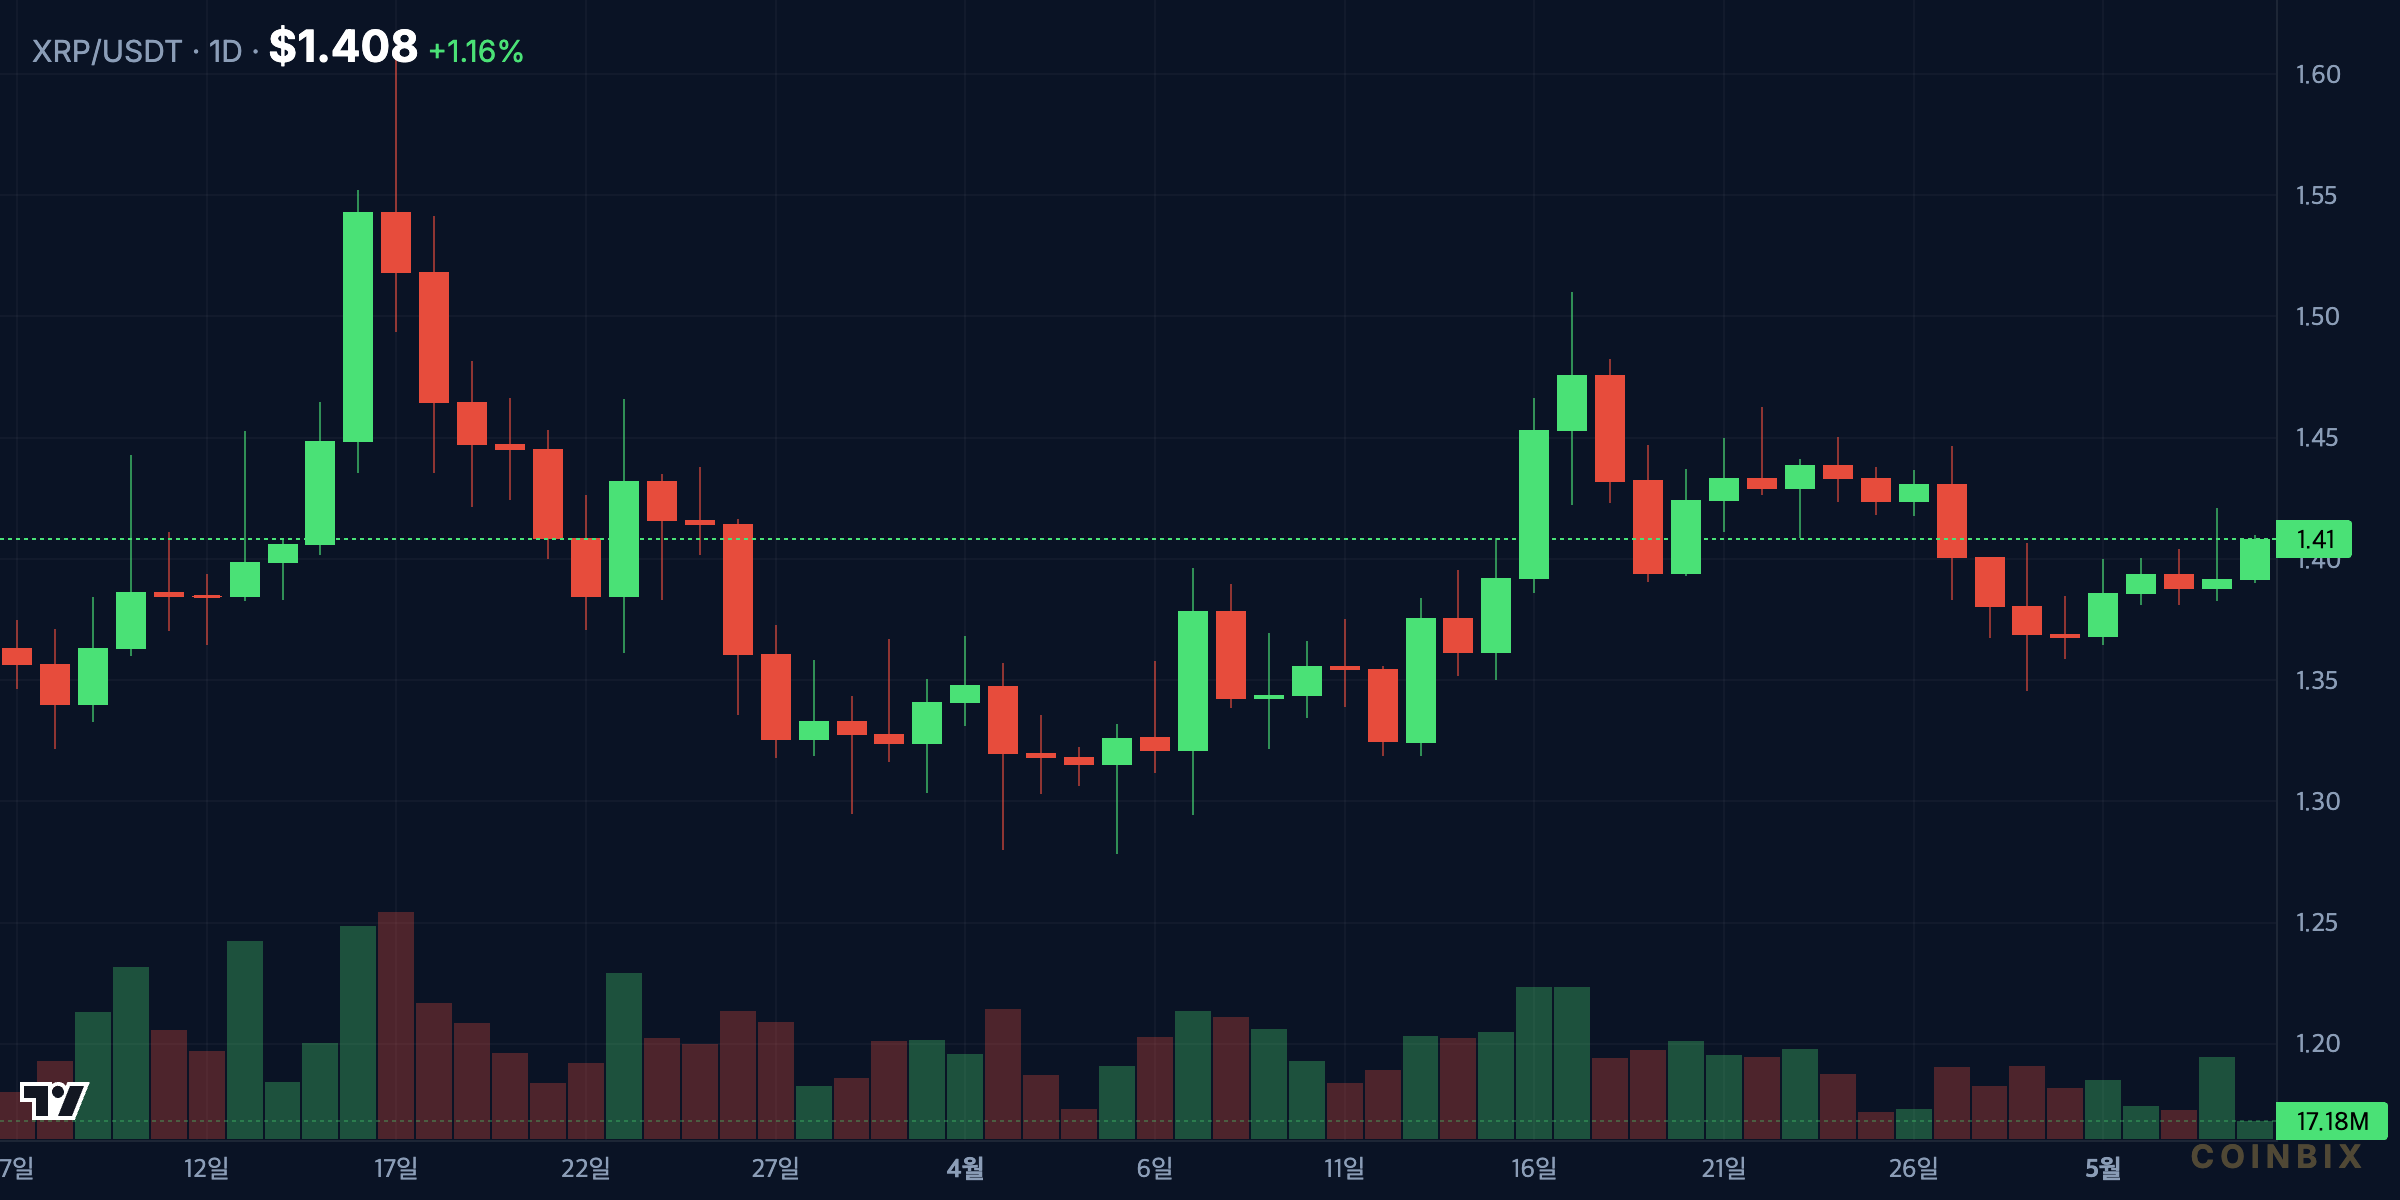
The daily chart should be evaluated through closing price quality, not only intraday extremes. XRP’s dip to $1.3865 is important, but the market’s ability or failure to close relative to $1.40 is more useful for trend assessment. If daily candles keep closing beneath $1.40, the level becomes a stronger resistance shelf. If closes recover above it quickly, the breakdown becomes less reliable.
Exponential moving averages can help define whether the current move is trend damage or range noise. If XRP is trading below short-term EMAs while those averages flatten or roll over, momentum is deteriorating. If price reclaims those averages together with $1.40-$1.41, the setup improves because buyers would be recovering both horizontal and dynamic resistance.
The daily support map is straightforward. The first floor is $1.38 because that is where the recent selloff stabilized. Below that, $1.34 is the next level to watch because it represents the first projected downside area after range failure. The $1.30 level is more psychological and may attract liquidity because round numbers often become visible targets for both discretionary and algorithmic participants.
Resistance is equally clear. The $1.40 pivot is the immediate test, while $1.41-$1.42 is the real breakout zone. A move above $1.40 alone is not enough because XRP already showed it can briefly reclaim that line and fail. The better bullish signal would be acceptance above the entire $1.41-$1.42 band, ideally with higher volume than the consolidation phase.
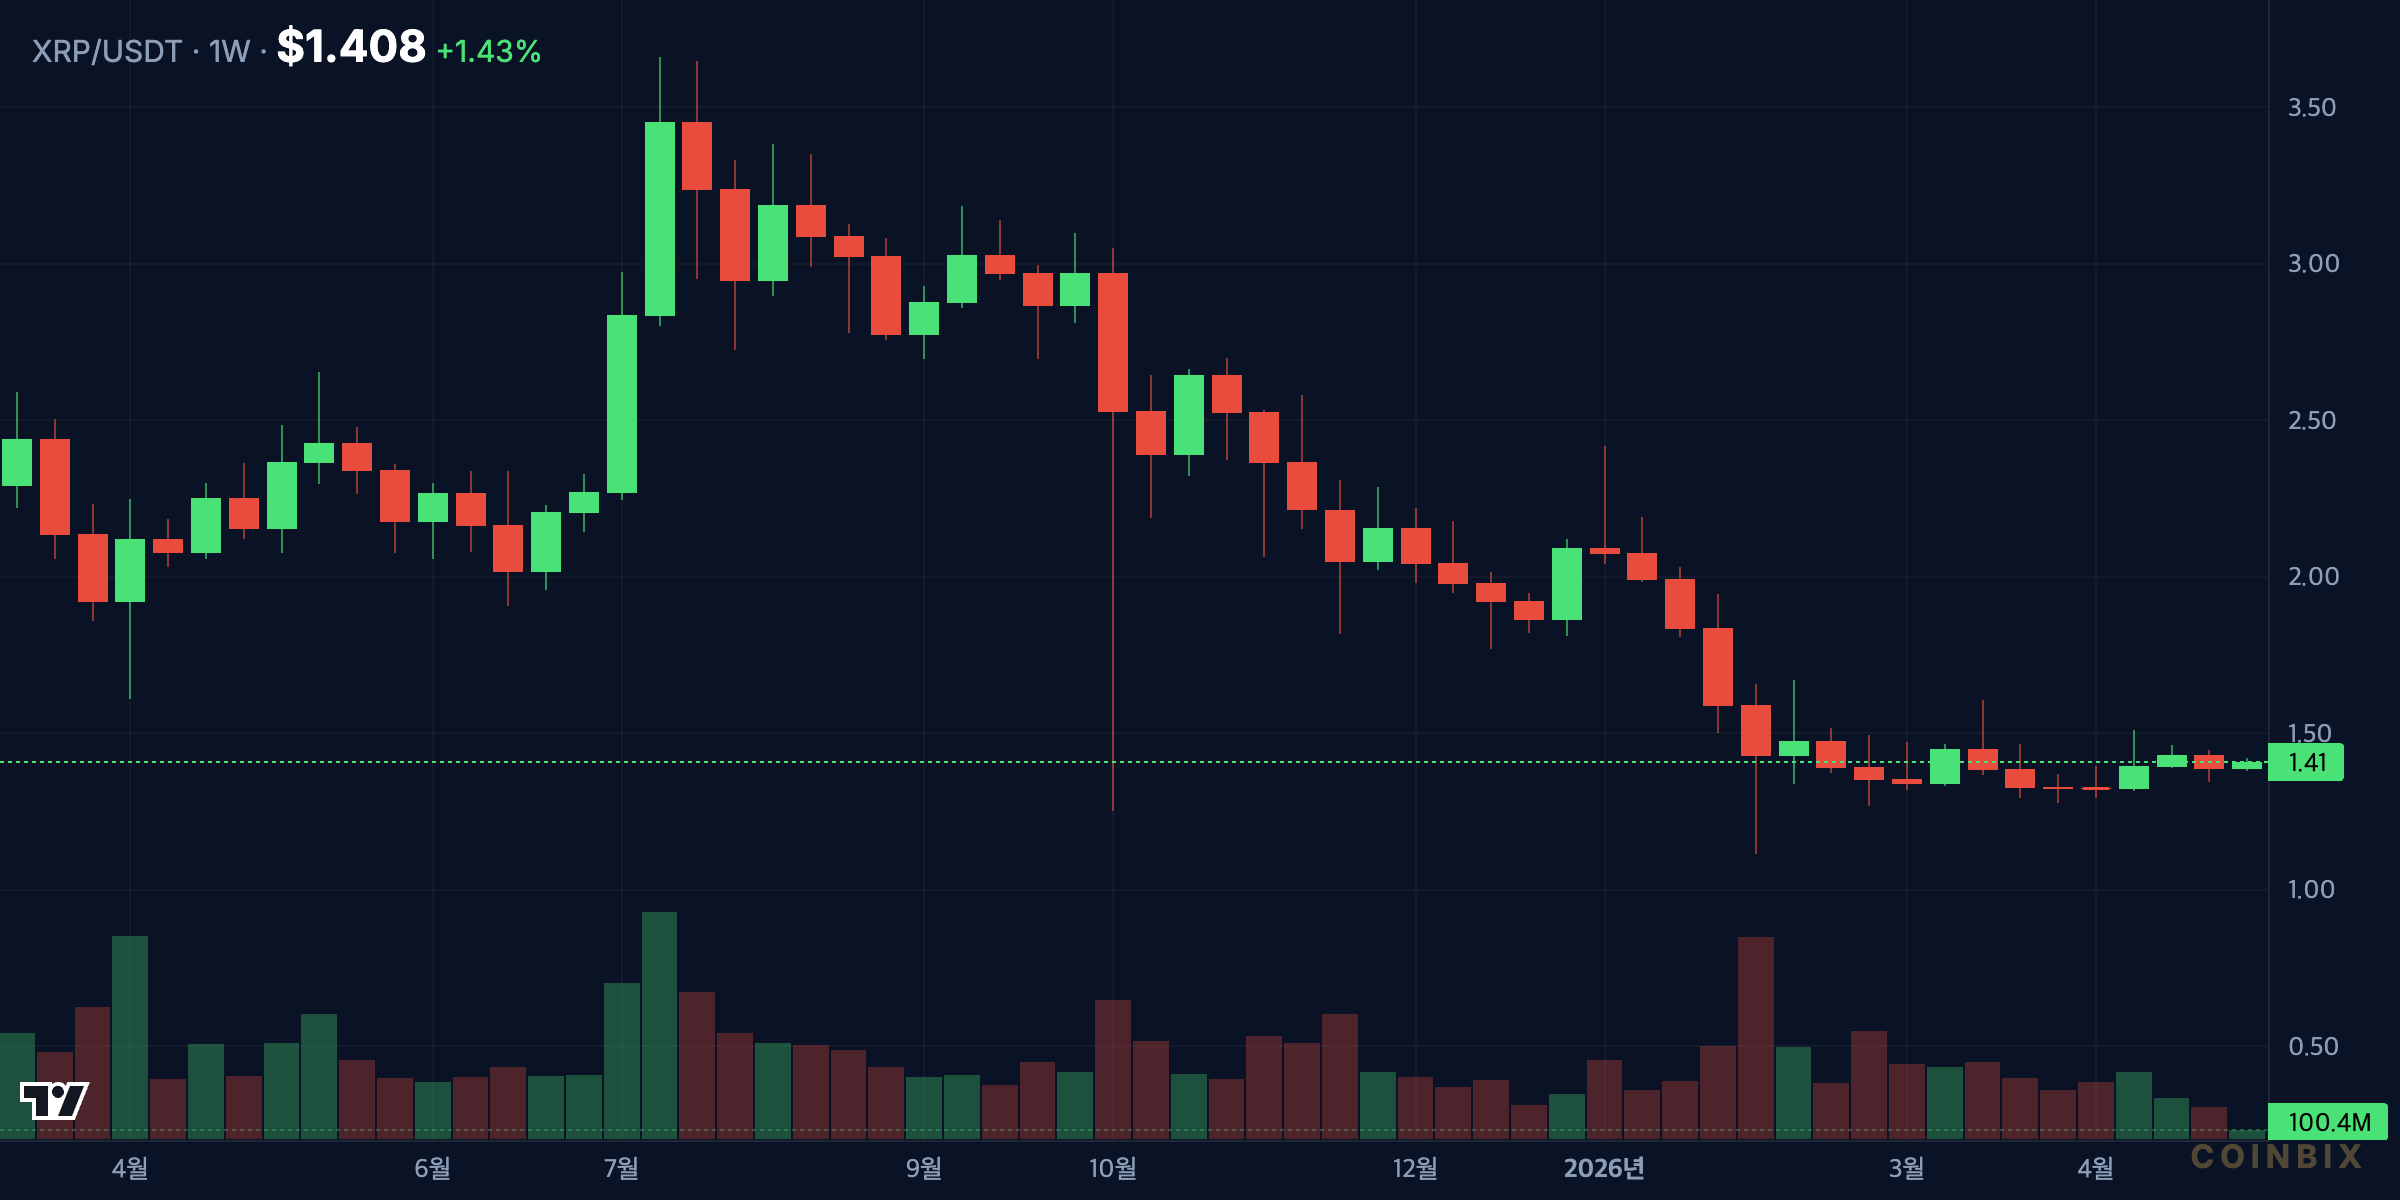
Weekly Chart: Is the Broader Trend Still Intact?
The weekly chart helps separate short-term noise from broader trend context. A single move below $1.40 may look severe on intraday charts, but the weekly picture asks whether XRP is still holding above its broader structural base. If weekly candles continue to respect higher support zones and avoid a close below $1.30, the larger trend may remain constructive despite short-term pressure.
However, the weekly chart also raises the stakes. When a market compresses near a major pivot after a large move, the eventual break can influence positioning beyond short-term participants. A weekly close below $1.38 would make the recent weakness harder to dismiss, especially if it comes with expanding volume. It would suggest that sellers are not merely reacting intraday but are controlling the broader tape.
On the upside, a weekly recovery above $1.42 would improve the structure significantly. It would show that the lower-timeframe breakdown failed and that demand returned at the exact point where the market could have extended lower. That kind of recovery often forces sidelined buyers to reassess because the invalidation level becomes cleaner: below $1.38.
What Traders Should Watch
The most important level is $1.40 because it is the pivot that changed roles. A sustained reclaim would tell the market that sellers lost control of the breakdown. A sustained rejection would confirm that the former support has become resistance. Around that pivot, traders should watch the following levels and signals:
- $1.38 support: This is the immediate floor. A clean break below it opens the path toward $1.34 and then $1.30.
- $1.40 pivot: This is the first recovery level. XRP needs more than a brief wick above it; it needs acceptance.
- $1.41-$1.42 resistance: This is the breakout confirmation zone. A close above it would shift short-term momentum back toward buyers.
- Volume expansion: The next move should be judged by participation. A low-volume breakout or breakdown carries higher failure risk.
- Closing price behavior: Intraday moves matter, but daily and four-hour closes around $1.40 and $1.38 will give cleaner signals.
The base case is not that XRP must break in one direction immediately. The better reading is that compression has made the next confirmed move more important. Above $1.42, the market can begin rebuilding toward higher resistance zones. Below $1.38, downside risk expands because the recent stabilization would no longer be valid.
Bull and Bear Scenarios for XRP
The bullish scenario begins with XRP defending $1.38 and reclaiming $1.40 on stronger volume. If that move continues through $1.41-$1.42, the market would have evidence that the heavy-volume drop was absorbed rather than extended. In that case, momentum could rotate back toward the upside as short-term sellers cover and buyers respond to a failed breakdown setup.
The bearish scenario begins with rejection at $1.40 and a loss of $1.38. That would confirm that sellers defended the pivot and forced a new leg below the stabilization zone. The first downside area would be $1.34, followed by $1.30 if liquidity accelerates. A break of $1.30 would be more serious because it would damage the broader psychological structure and likely shift attention to deeper weekly support.
The neutral scenario is continued chop between $1.38 and $1.42. That may frustrate directional positioning, but it would also give the market more time to rebuild liquidity. In that environment, range tactics usually outperform breakout assumptions until price closes outside the band. The longer XRP compresses, the more important the eventual expansion becomes.
Conclusion: XRP Needs Confirmation, Not Guesswork
XRP’s drop below $1.40 was meaningful because it came with heavy volume and changed the role of a key level. The market stabilized above $1.38, but the late attempt to reclaim $1.40 failed to hold. That leaves XRP in a tight range where both bullish and bearish cases are possible, but neither is confirmed.
The cleanest bullish trigger is a reclaim of $1.40 followed by acceptance above $1.41-$1.42 with renewed volume. The clearest bearish trigger is a loss of $1.38, which would bring $1.34 and $1.30 into focus. Until one of those conditions appears, XRP remains in a compression phase where patience and level discipline matter more than headline-driven reaction.
Bybit 20% Fee Discount
Free Coinbix Premium Channel
FAQ
Why did XRP fall below $1.40?
XRP fell below $1.40 after a heavy-volume move from $1.4109 to $1.3987, with selling pressure extending to $1.3865. The key issue is that $1.40 has now shifted from support into short-term resistance.
What level confirms an XRP breakout?
A stronger XRP breakout signal would be a sustained move above $1.41-$1.42, ideally with volume expanding above the recent consolidation phase. A brief move above $1.40 alone is not enough because the latest rebound failed to hold that level.
What happens if XRP loses $1.38?
If XRP loses $1.38, the recent stabilization zone fails and downside risk expands toward $1.34 first. If selling accelerates, $1.30 becomes the next major psychological level to watch.
Is XRP still in a bullish trend?
XRP can remain structurally constructive if it defends $1.38 and recovers $1.41-$1.42. A weekly close below $1.38, especially on rising volume, would make the broader trend look more vulnerable.
Affiliate Disclosure: This page contains affiliate links. Coinbix may earn a commission at no extra cost to you.
Disclaimer: This article is for informational purposes only and does not constitute financial advice. Cryptocurrency investments carry significant risk. Always conduct your own research before making investment decisions.