Key Takeaways
- ▼ Ethereum is struggling to reclaim the 20-day EMA near $2,285 and remains below the 100-day and 200-day EMAs, keeping the medium-term trend cautious.
- ▲ ETH is still above the 50-day EMA near $2,245 and has held the $2,016-$2,050 support zone, giving bulls a short-term defense line.
- ■ Market data shows ETH at about $2,278, with a 24-hour gain near 1.0%, a 7-day decline of 1.38%, and a 30-day gain of 5.95%.
Ethereum Market Snapshot: A Rebound Without Conviction
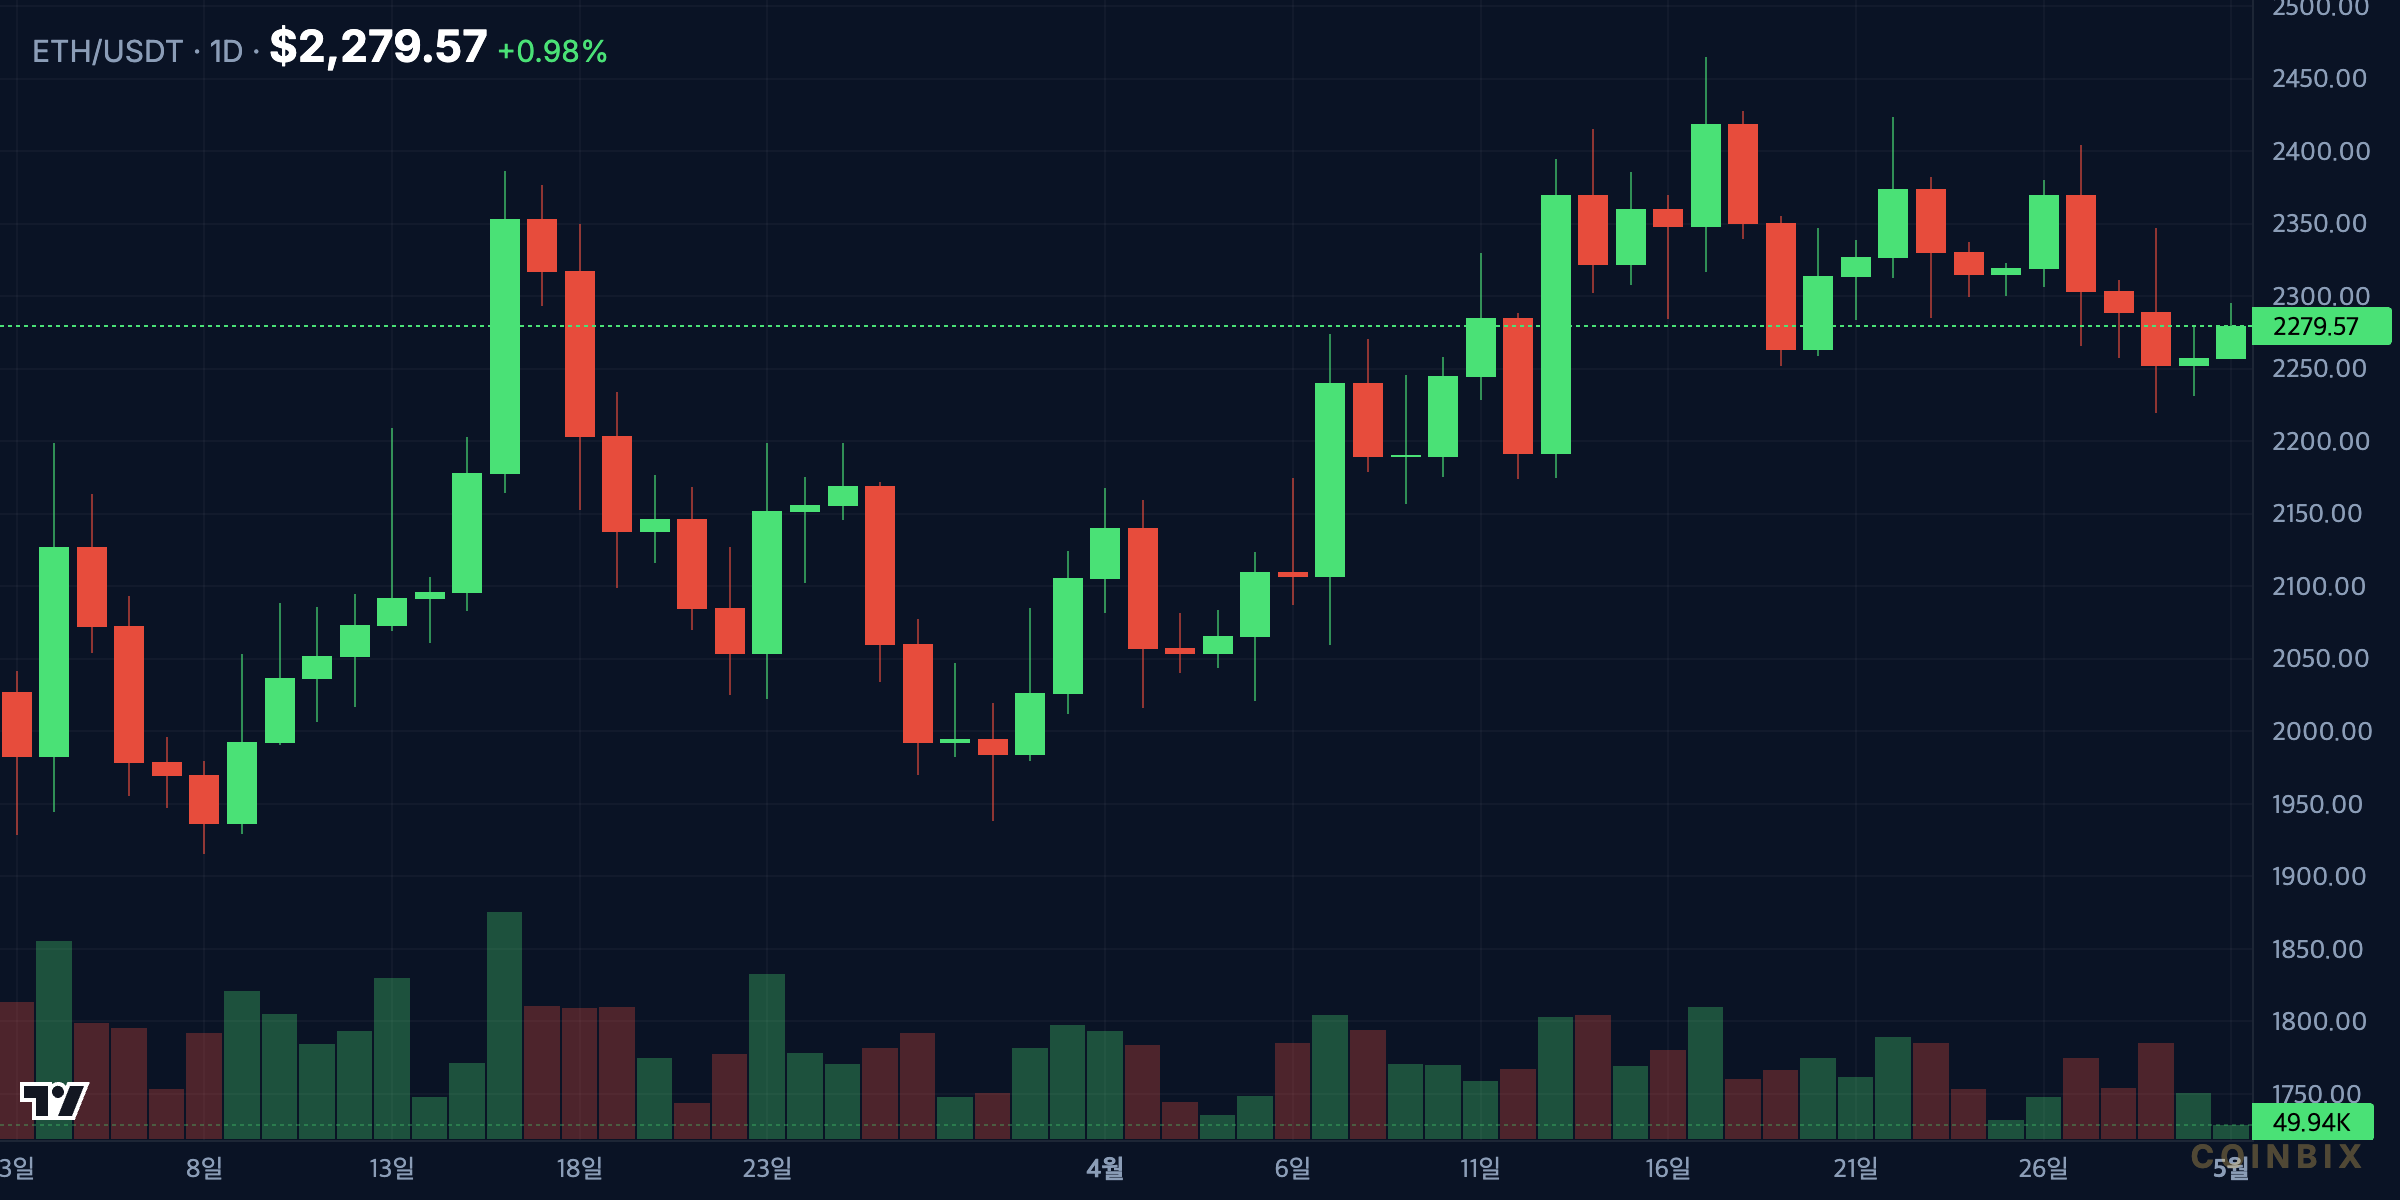
Ethereum is trading in a narrow and strategically important range. Based on current market data, ETH is priced near $2,278, with a market capitalization of roughly $275 billion and 24-hour volume near $10.13 billion. The headline numbers are mixed rather than decisively bullish or bearish: ETH is up about 0.98% over 24 hours, down 1.38% over seven days, and up 5.95% over 30 days.
That combination matters. A positive 30-day change suggests Ethereum has stabilized from its lower range, but the negative 7-day reading says momentum has faded. In market structure terms, ETH is not in free fall, but it is also not confirming a clean upside continuation. The current price sits close to short-term moving averages and below longer-term trend gauges, creating a setup where small changes in flow can produce outsized chart signals.
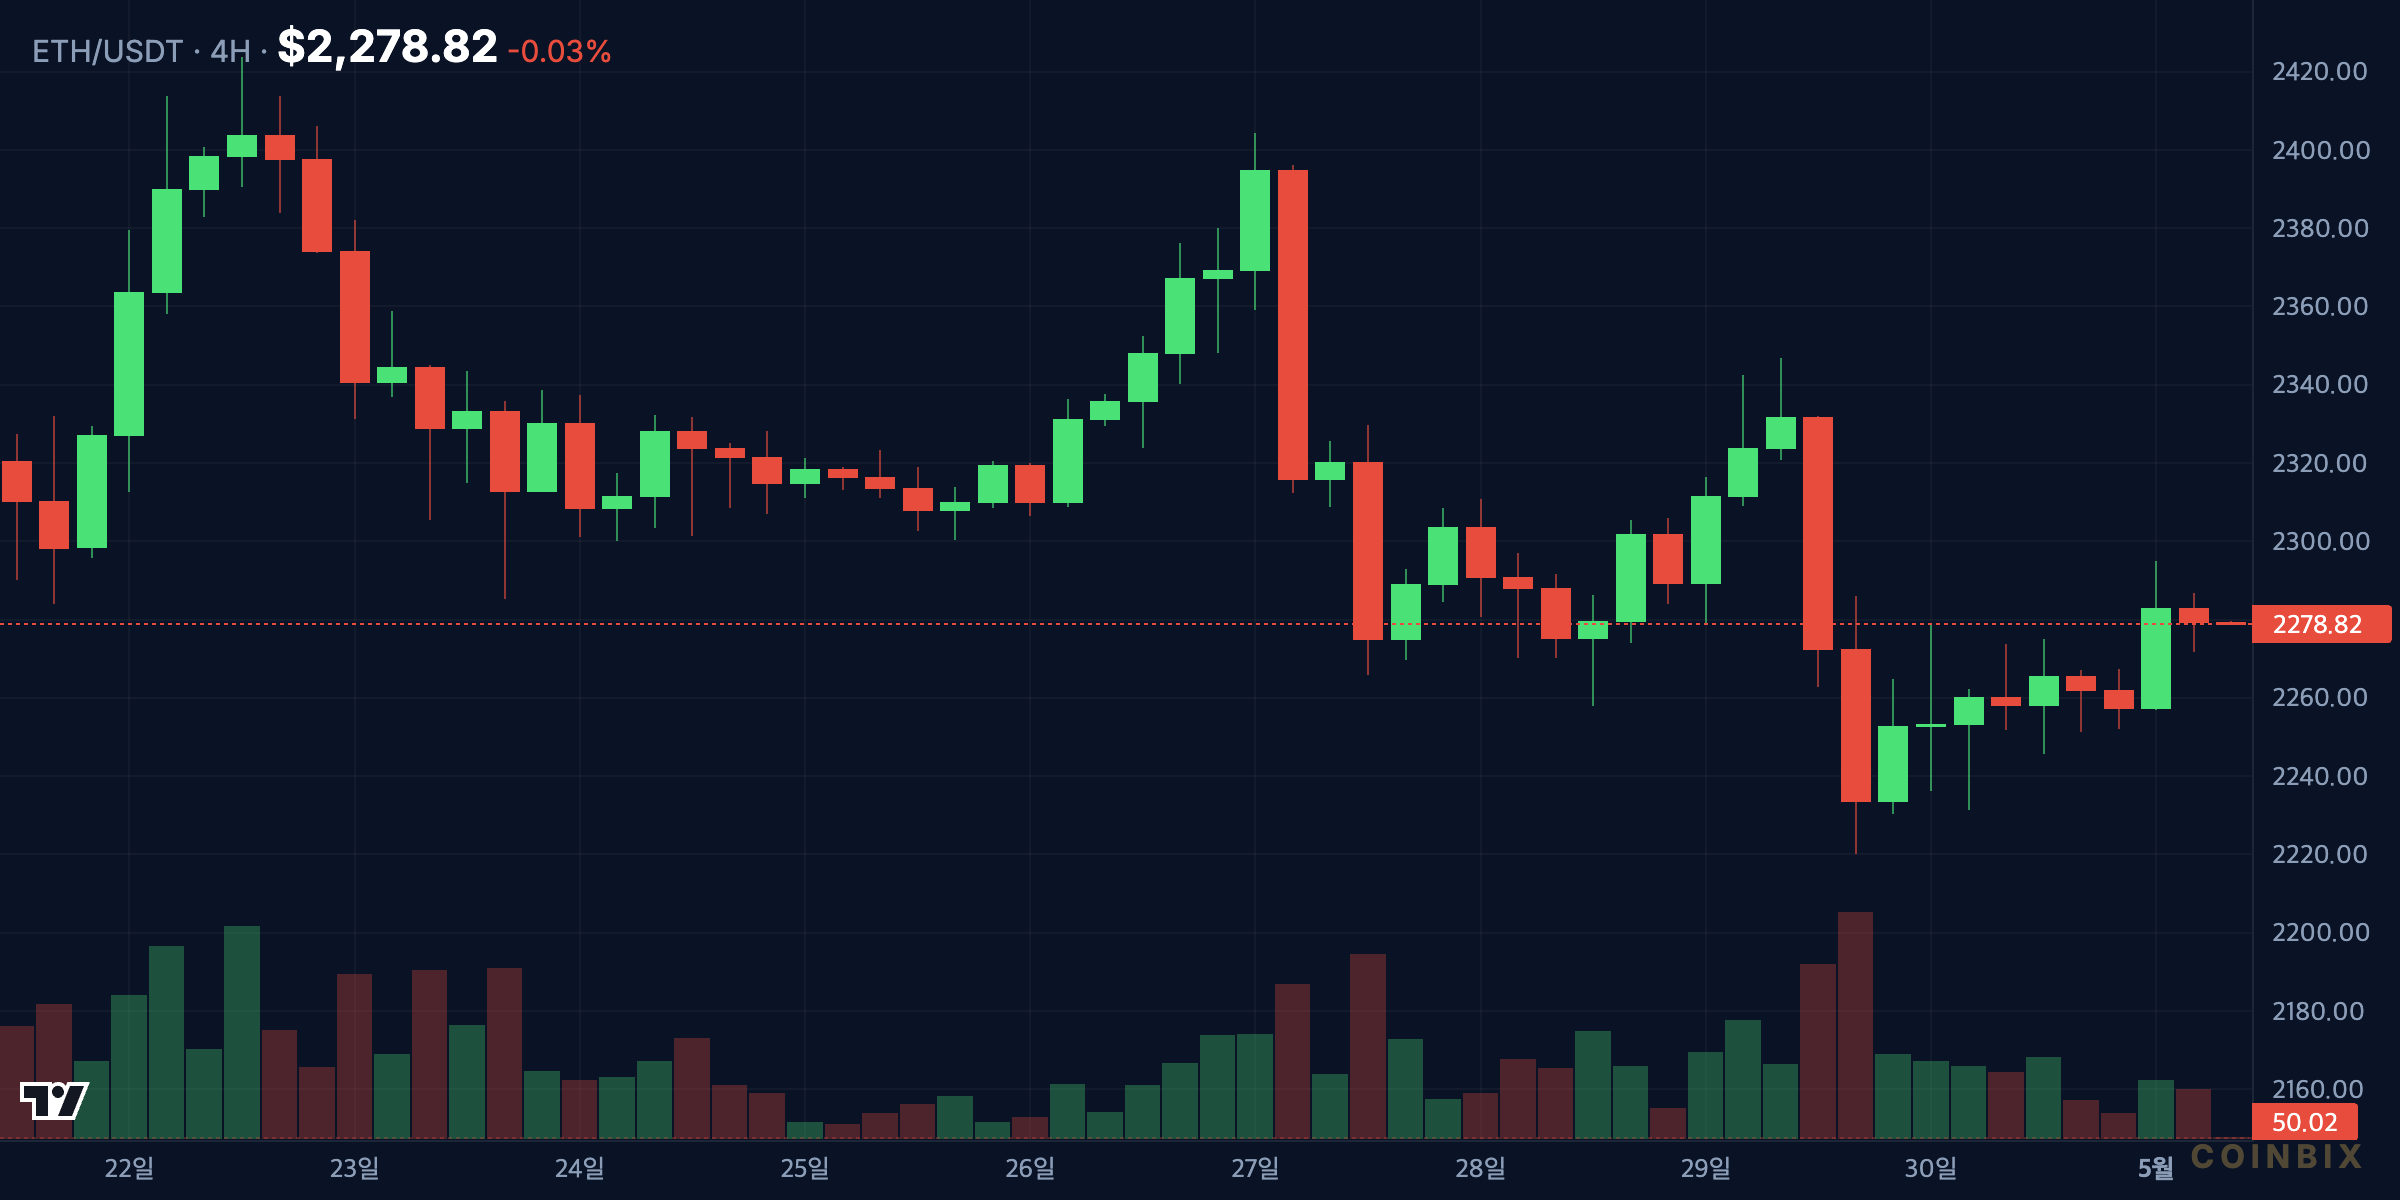
On Binance spot ETHUSDT daily data, the latest daily candle is near $2,279 after trading between roughly $2,257 and $2,296. That is a compressed intraday range compared with the wider 30-day band, which runs from about $2,016 to $2,465. Compression after a rebound often precedes expansion, but direction depends on whether buyers can force acceptance above resistance or sellers can push price back through nearby support.
What Levels Matter Most for ETH?
The first support zone is $2,245-$2,285, where the 50-day and 20-day exponential moving averages are clustered. Binance daily data places the 20-day EMA near $2,285 and the 50-day EMA near $2,245. ETH trading between those two levels indicates balance, not dominance. A daily close above the 20-day EMA would improve short-term momentum, while a close below the 50-day EMA would make the rebound look increasingly vulnerable.
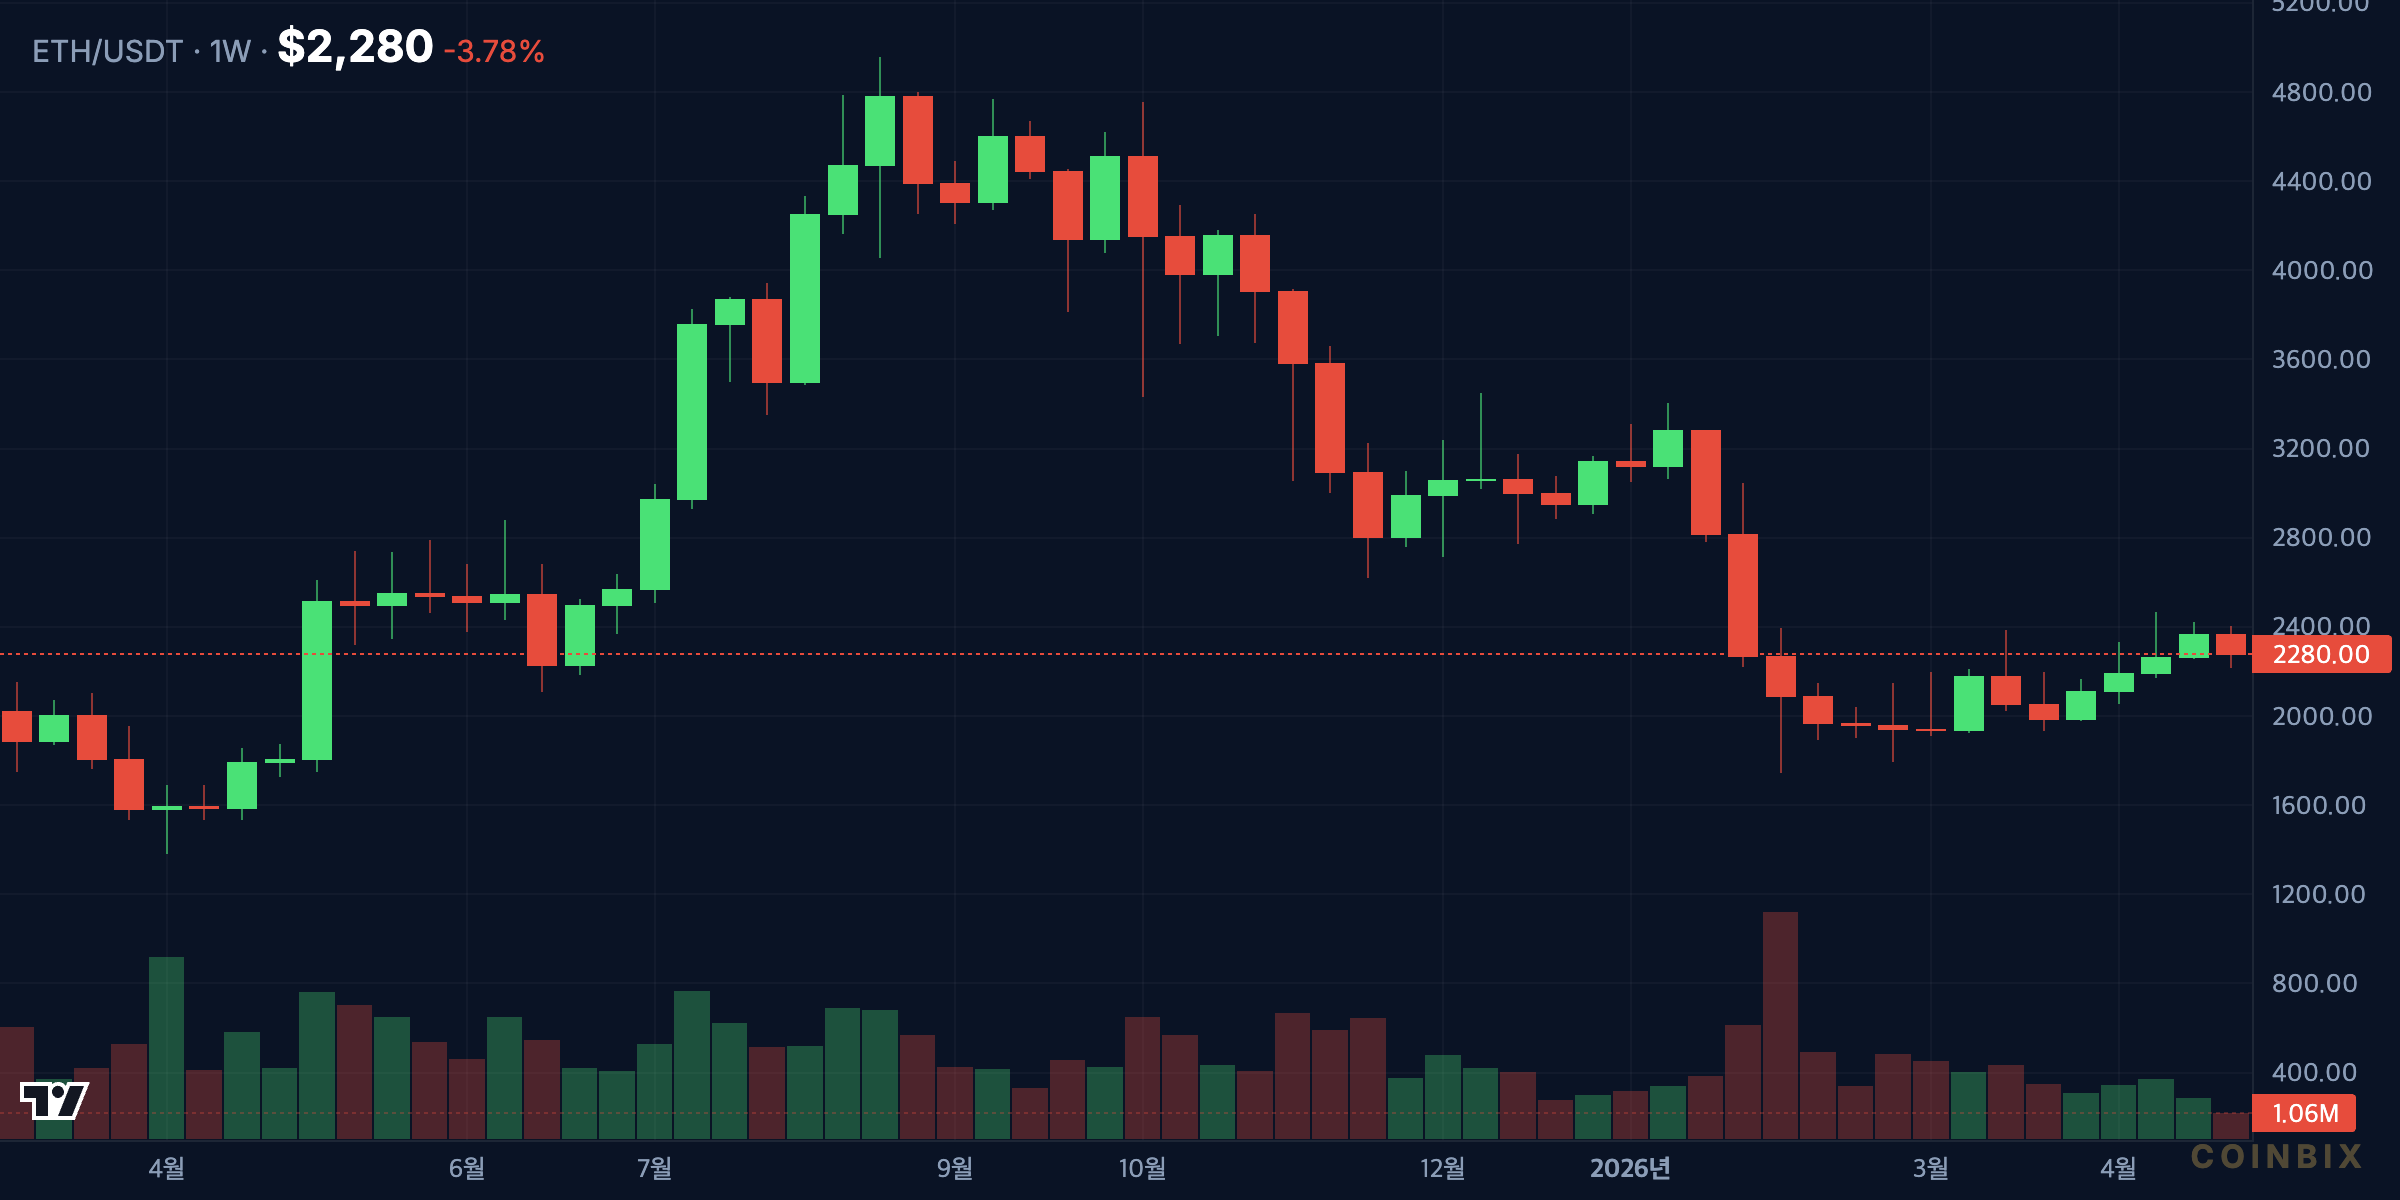
The second support zone is $2,016-$2,050, the lower edge of the 30-day trading range. This area is more important than a single round number because it is where recent downside attempts have been absorbed. If ETH loses that zone on rising volume, the market would likely reassess the entire April rebound and look toward the deeper 90-day reference area. The 90-day low near $1,743 is not the base case, but it becomes relevant if $2,016 fails and macro risk appetite deteriorates at the same time.
Resistance is clearer. The first ceiling is $2,465-$2,476, matching the 30-day and 90-day highs on Binance data. A break above that band would show that ETH can move beyond the upper boundary of its current consolidation. But resistance does not end there. The 100-day EMA is near $2,353, which means ETH must also hold above that moving average if a breakout attempt is to look durable. Beyond that, the 200-day EMA near $2,723 remains the larger trend test. Until ETH can recover and hold above the 200-day EMA, institutional-style trend models are likely to view rallies as corrective rather than impulsive.
EMA Structure Shows a Market Still Under Pressure
Ethereum’s EMA stack is not yet bullish. A healthier upside trend would normally show price above the 20-day, 50-day, 100-day, and 200-day EMAs, with shorter averages above longer ones. ETH currently does not meet that standard. Price is near the 20-day EMA, slightly above the 50-day EMA, below the 100-day EMA, and well below the 200-day EMA.
That arrangement points to a short-term rebound inside a broader corrective structure. The 20-day EMA near $2,285 is almost exactly where spot ETH is trading, which makes it a live momentum filter. If ETH closes several sessions above that level, short-term buyers may gain confidence. If it repeatedly rejects there, sellers will have a simple technical argument: the rebound is losing strength before reaching the 100-day and 200-day trend barriers.
Volume adds another caution flag. The latest Binance spot volume figure is around 20,472 ETH, while the 20-day average is about 123,232 ETH. A lower-volume session by itself is not bearish, especially during consolidation, but it means the current lift has not yet been validated by strong participation. For a more convincing bullish reversal, ETH would need a close above $2,465 accompanied by materially higher turnover. Without that, the market may continue to rotate inside the range.
Macro Backdrop: Rates and Dollar Pressure Limit Risk Appetite
Ethereum does not trade in isolation. It is a crypto asset, a technology beta proxy, and a liquidity-sensitive risk instrument. The macro backdrop therefore remains important, especially when the chart is near a decision point.
Federal Reserve Economic Data shows the effective federal funds rate at 3.64% through late April. That level is not an emergency tightening shock, but it remains high enough to keep real-yield and cash-return competition relevant. When short-term dollar yields are still attractive, speculative assets often need stronger growth, adoption, or liquidity catalysts to sustain major upside trends.
The 10-year Treasury yield is another key input. FRED’s DGS10 series rose from 4.33% on April 1 to 4.42% on April 29. Rising long-term yields can pressure long-duration risk assets because they increase the discount rate applied to future cash flows and speculative network value. Ethereum is not an equity, but market participants often price it alongside other high-beta assets when yields move sharply.
The dollar picture is more nuanced. FRED’s broad dollar index proxy, DTWEXBGS, eased from 120.12 on April 1 to 118.73 on April 24. A softer dollar can support crypto liquidity at the margin, particularly for non-U.S. participants. However, the benefit has not translated into a decisive ETH breakout. That divergence suggests Ethereum still needs crypto-native catalysts, not just a softer dollar, to clear resistance.
The macro reading is therefore mixed. Dollar weakness is mildly supportive. Stable but elevated policy rates are neutral-to-restrictive. Rising 10-year yields are a headwind. For ETH, that means technical confirmation matters more than macro narratives. If price cannot reclaim the 100-day EMA while the 10-year yield is rising, the market may keep fading rallies into resistance.
 Bybit 20% Fee Discount
Free Coinbix Premium Channel
On-Chain and Network Context: Fundamentals Are Not the Problem
Ethereum’s cautious chart does not mean its network has lost relevance. The asset remains the largest smart-contract platform by market value, the settlement layer for a large share of decentralized finance activity, and the base asset for a major staking economy. Market-cap rankings still place ETH as the second-largest crypto asset by market capitalization, behind Bitcoin.
The issue is not whether Ethereum has a fundamental role. The issue is whether the market is willing to pay a higher multiple for that role right now. Crypto investors often separate network quality from token momentum. A strong network can trade poorly if liquidity is tight, if alternative chains capture narrative attention, or if the market is focused on Bitcoin dominance rather than smart-contract beta.
That distinction is important for this analysis. Long-term holders may view the $2,000 area as a value zone relative to Ethereum’s all-time high, while shorter-term participants are focused on the EMA structure and the $2,465 resistance band. Fundamentals explain why investors care about ETH; price action shows whether capital is acting on that view today.
Bearish and Bullish Scenarios for May
Bearish scenario: ETH loses the EMA shelf
The bearish case begins with ETH failing to hold the $2,245-$2,285 EMA cluster. A daily close below the 50-day EMA would suggest the short-term rebound is weakening. If that move is followed by a break of $2,016, the market would likely target the wider 90-day range and reassess the $1,743 low as a downside reference. In this scenario, the 100-day EMA near $2,353 becomes rejection resistance rather than a recovery target.
This case becomes more convincing if it coincides with rising Treasury yields, a firmer dollar, or declining spot volume during upside attempts. Repeated failure near $2,465 would show that supply remains active above the range.
Bullish scenario: ETH reclaims range resistance
The bullish case requires more evidence. ETH first needs to reclaim the 20-day EMA and hold above the 100-day EMA near $2,353. The real trigger would be a daily close above $2,465-$2,476 with stronger-than-average volume. That would turn the 30-day high from resistance into a potential support retest and open a path toward the 200-day EMA near $2,723.
A sustained close above $2,723 would be the first serious signal that the medium-term structure is changing. Until then, any move into the upper $2,000s should be viewed as a test rather than confirmation.
Base case: range trading until confirmation
The base case is continued range trading between roughly $2,016 and $2,465. This is not exciting, but it is consistent with the data. ETH has a positive 30-day performance, a weak 7-day reading, a mixed EMA profile, and a macro backdrop that is not aggressively supportive. That combination often produces choppy price action rather than a straight-line trend.
For investors, the practical conclusion is patience. The current price is too close to key moving averages to justify a strong directional call without confirmation. ETH below $2,245 would increase downside risk. ETH above $2,465 with volume would shift the balance toward a recovery attempt. Between those levels, the market is still negotiating value.
Conclusion: Ethereum Needs Proof Above $2,465
Ethereum’s market structure is cautious, not broken. ETH has held above the $2,000 area and remains positive over 30 days, but the recovery has not cleared the resistance needed to confirm a new uptrend. The 20-day and 50-day EMAs form the immediate battleground, while the 100-day and 200-day EMAs remain overhead trend tests.
The cleanest interpretation is that Ethereum is in a fragile consolidation. Bulls need a close above $2,465-$2,476 and follow-through toward $2,723. Bears need a break below $2,245 and then $2,016 to regain control. Until one side wins, ETH is likely to remain sensitive to macro data, dollar liquidity, and broader crypto risk sentiment.
For now, the burden of proof is on buyers. Ethereum has enough fundamental strength to remain institutionally relevant, but the chart is asking for confirmation. Without that confirmation, rallies into resistance deserve caution.
Bybit 20% Fee Discount
Free Coinbix Premium Channel
FAQ
Is Ethereum bullish or bearish right now?
Ethereum is neutral-to-cautious. ETH is holding above the 50-day EMA near $2,245, but it remains below the 100-day EMA near $2,353 and the 200-day EMA near $2,723. A close above $2,465 would improve the bullish case.
What is the key Ethereum support level?
The first key support area is $2,245-$2,285, where the 50-day and 20-day EMAs are clustered. The larger downside support zone is $2,016-$2,050, which marks the lower edge of the recent 30-day range.
What resistance must ETH clear?
ETH must clear $2,465-$2,476 to break the recent range. After that, the 200-day EMA near $2,723 becomes the major medium-term trend test.
How does the macro backdrop affect Ethereum?
Elevated Fed rates and a rising 10-year Treasury yield can limit risk appetite, while a softer dollar can help crypto liquidity. The current macro mix is not hostile enough to force a breakdown, but it is not strong enough to confirm an ETH breakout by itself.
Affiliate Disclosure: This page contains affiliate links. Coinbix may earn a commission at no extra cost to you.
Disclaimer: This article is for informational purposes only and does not constitute financial advice. Cryptocurrency investments carry significant risk. Always conduct your own research before making investment decisions.